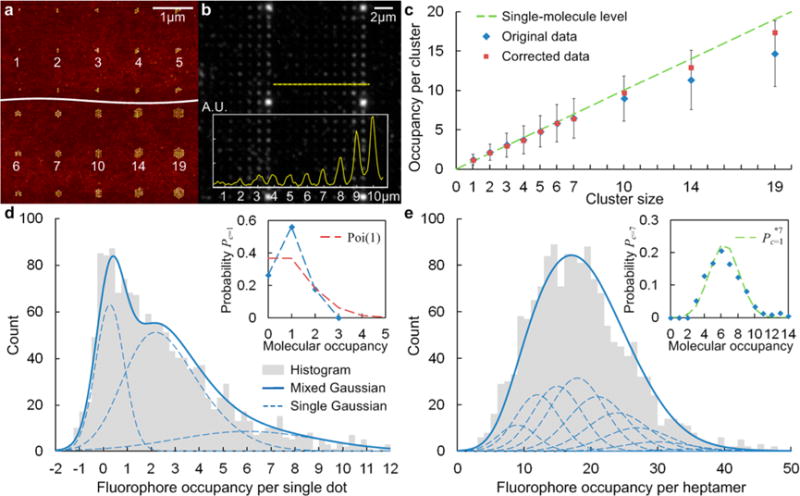
Figure 4.

Heterogeneous nanoarray with various cluster sizes: (a) AFM image and (b) fluorescence image. (c) Histogram of the molecular occupancy per cluster vs cluster size. Fluorophore and molecular occupancy distributions for (d) single dot and (e) heptamer arrays. A mixed Gaussian fit was applied to the fluorophore occupancy histogram to estimate the probability of molecular occupancy. The set of single Gaussians are the nth convolution powers based on the Gaussian approximation of the binomial distribution (fluorophore number per streptavidin with an average of F/P ratio r = 3).
