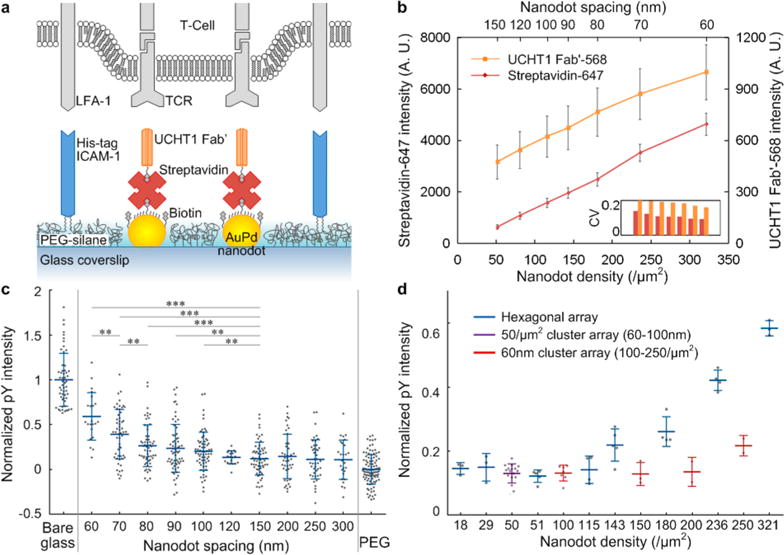
Figure 5.

(a) Schematic diagram of the bifunctional nanoarray surface with a live T-cell. (b) Fluorescence intensity of both streptavidin-647 and UCHT1 Fab′-568 for hexagonal arrays with various spacings. Normalized pY intensity after 5 min stimulation: (c) plot against nanodot spacing, individual cells shown as dots, *** = p < 0.001, ** = p < 0.01 (Wilcoxon rank sum test); positive control, nonspecifically bound Fab′ and ICAM-1 on bare glass (maximum concentration); negative control, PEG passivation background (minimized concentration). (d) Plot against nanodot density, individual experiments shown as dots.
