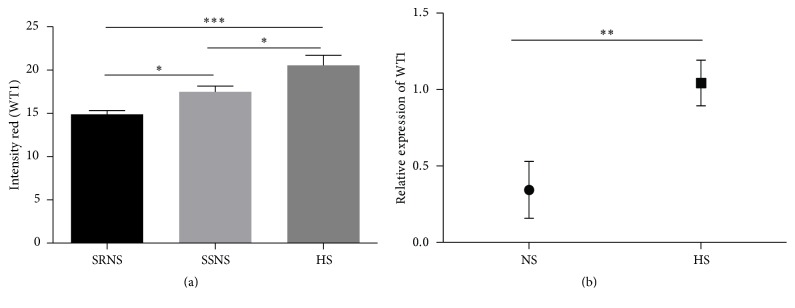
Figure 2.
WT1 expression in podocytes from renal biopsies of patients with NS. (a) WT1 expression immunofluorescence. HS: healthy subjects; SSNS: steroid-sensitive NS; and SRNS: steroid-resistant NS. WT1 expression was measured by pixel intensity. (b) Relative expression levels of WT1 by real-time PCR. ∗p < 0.05, ∗∗p < 0.01, and ∗∗∗p < 0.001.

