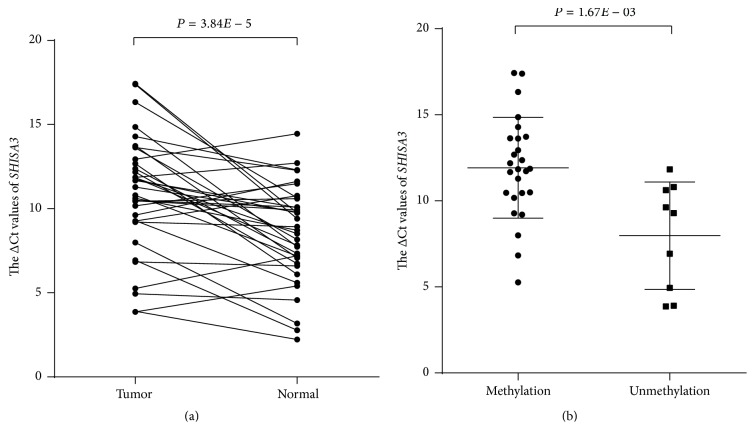
Figure 2.
The expression of SHISA3 assessed using quantitative RT-PCR assay. (a) Expression levels of SHISA3 in LSCC and adjacent normal samples (n = 35). The SHISA3 expression level was significantly lower in tumor tissues than in corresponding normal tissues (P = 3.84E − 05). (b) Expression levels of SHISA3 in the methylation group (n = 26) and unmethylation group (n = 9). The SHISA3 expression levels were significantly lower in the methylation group compared with the unmethylation group (P = 1.67E − 03).

