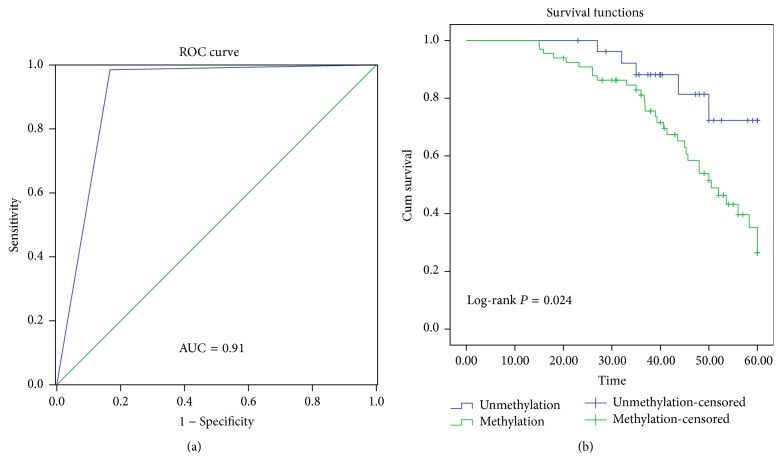
Figure 4.
The receiver operating characteristic (ROC) curve and survival curve. (a) The ROC analyses of the curve. The area under the curve was 0.91. (b) The survival curve of patient groups according to SHISA3 methylation status. The SHISA3 methylation group showed significantly worse survival rates than the SHISA3 unmethylation group (log-rank P = 0.024).

