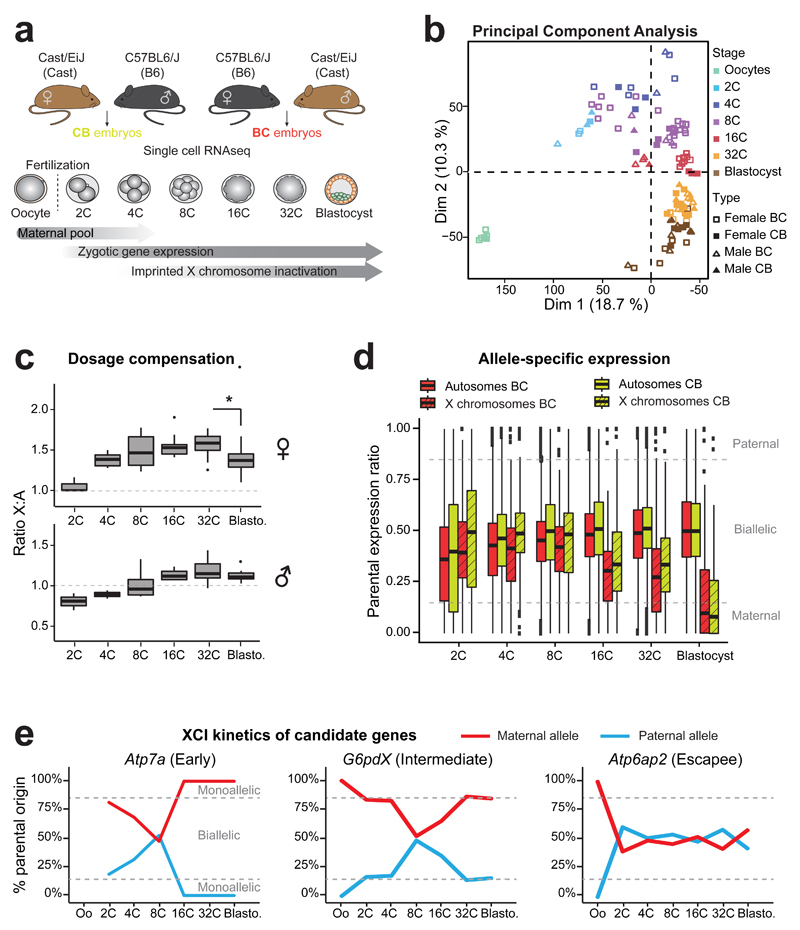
Figure 1. Single cell RNA sequencing of early hybrid embryos and dosage compensation mechanisms.
(a) Schematic illustration of the single cell experiment and the harvested stages during pre-implantation mouse development. Time windows showing the persistence of maternal mRNA pool, activation of zygotic gene expression and Xp inactivation are indicated.
(b) Principal component analysis (PCA) of single oocytes and pre-implantation blastomeres (2C to blastocysts) based on scRNA data. Different stages are designed by different colors. n= 6 to 30 cells per stage (details of each single cell are in Supplementary Data Set 1).
(c) Differences in ratio of X-chromosome expression levels by autosomal expression levels, between 2-cell stage to blastocyst, using Dunn¹s test (Kruskal-Wallis), p<0.001 to **. Boxplots represent median with lower and upper quartiles.
(d) Allele-specific expression ratios for genes on autosomes (plain red, BC or yellow CB) and on X chromosomes (dashed red, BC or yellow, CB) in female single blastomeres (2-cell to blastocyst) from BC and CB crosses. Allele-specific proportion represents the number of reads mapped to the paternal genome divided by the total number of paternal and maternal reads mapped for each gene. Boxplots represent medians with lower and upper quartiles.
e) Examples of scRNA expression dynamics of three X-linked genes with their classification as “early inactivated”, “intermediate inactivated” or “escapee” (as used in Patrat et al, 2009 14) (see also Supplementary Figure 2). Mean percentage of parental origin transcripts is represented between oocytes and blastocyst.

