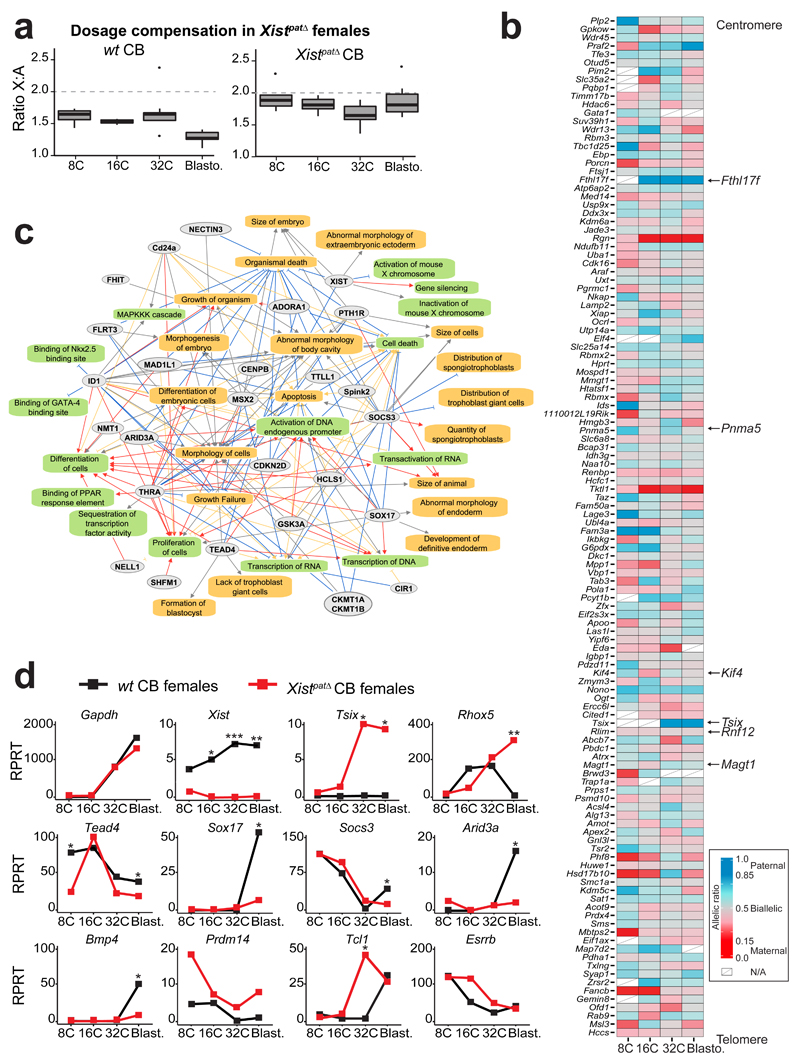
Figure 4. Paternal knockout of Xist impaired XCI, dosage compensation and differentiation pathways.
(a) Differences in ratio of X-chromosome expression levels by autosomal expression levels, between 8-cell stage to blastocyst in CB females (left panel) and Xistpat∆ CB females (with a paternally inherited knock-out allele) (right panel). Boxplots represent median with lower and upper quartiles.
(b) Heatmap representing allele-specific mean expression from 8-cell to blastocyst stage of X-linked genes (as in Figure 2) in Xistpat∆ mutant single cells. Strictly maternally expressed genes (allelic ratio ≤0.15) are represented in red and strictly paternally expressed genes (allelic ratio ≥0.85) in blue. Color gradients are used in between and genes have been ordered by genomic position. Tsix was included in the heatmap if it was expressed in at least 2 single cells per stage, even though it did not reach the expression threshold used (RPRT>4 and expressed in at least 25% of the cells of each stage and cross with a minimum of 2 cells). n = 122 genes.
(c) Major down-regulated genes and pathways detected between CB wt and CB Xistpat∆ females extracted from Supplementary Data Set 2, using QIAGEN’s Ingenuity Pathway Analysis (IPA) software (Supplementary Data Set 3). Color code for arrows, red: leads to inhibition; blue: leads to activation; orange: findings consistent with state of downstream molecule; grey: effect not predicted.
(d) Expression data of candidate genes from wt CB (black) and Xistpat∆ CB (red) females, extracted from scRNAseq. Mean of expression is represented in Reads Per Retro-Transcribed length per million mapped reads (RPRT) during early development (8-cell to blastocyst stages). Gapdh gene is a control housekeeping gene. n= 4 to 30 cells per stage and genotype. By Kruskal-Wallis test; p<0.05 corresponds to *.

