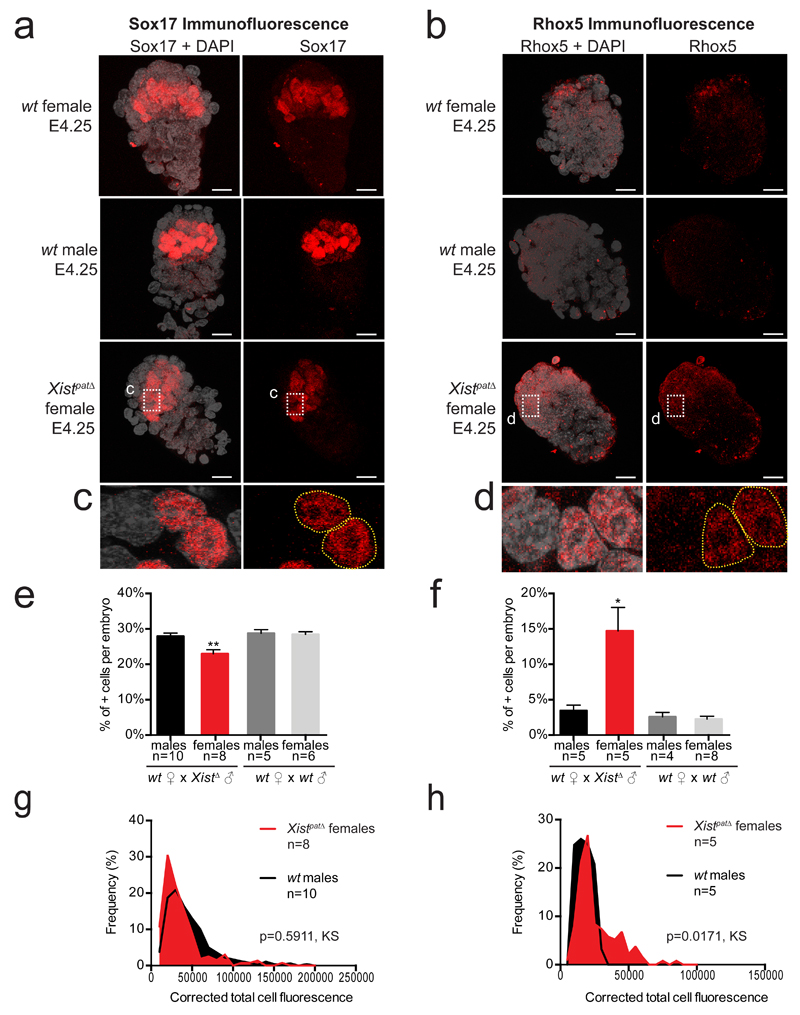
Figure 5. Abnormal Sox17 and Rhox5 patterns in Xistpat∆ female blastocysts.
Maximum intensity projection of wt and Xistpat∆ E4.25 blastocysts analyzed by immunofluorescence against Sox17 (a, c) or Rhox 5 (b, d). Staining for Sox17 or Rhox5 is in red, DAPI is in grey. Scale bar represents 20µm. Percentage of positive cells have been assessed and summarized as the median + s.e.m. for Sox17 (e) and Rhox5 (f). Numbers of embryos are indicated under each genotype. By Kruskal-Wallis test; p<0.05 and p<0.001 correspond respectively to * and **. Average distribution of positive single cell fluorescence was represented by measuring the corrected total cell fluorescence using ImageJ software (Fiji, NIH) for Sox17 (g) and Rhox5 (h) and tested by Kolmogorov-Smirnov test. All cells under 10,000 and 5,000 for total cell fluorescence, respectively for Sox17 and Rhox5, have been considered as negative.

