Figure.
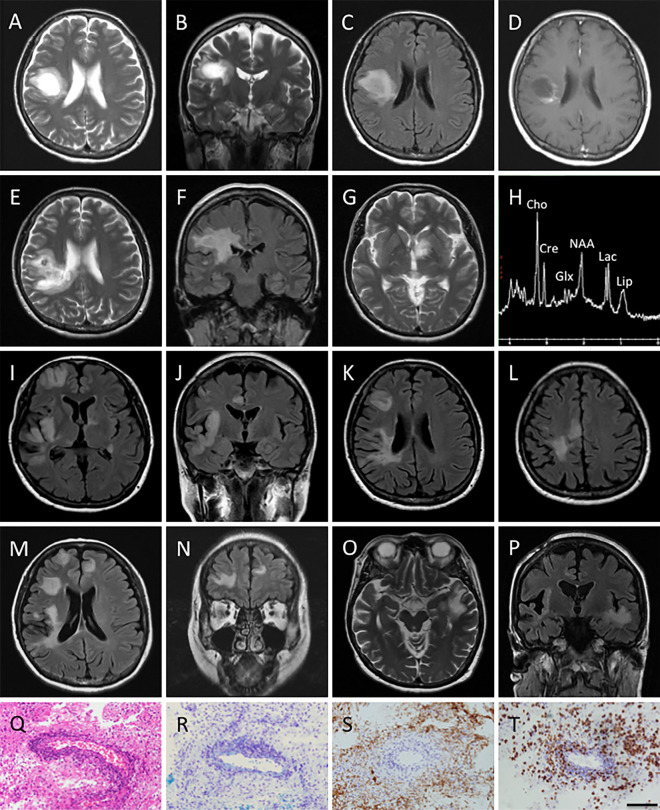
A-C: Axial and coronal T2-weighted magnetic resonance imaging (MRI) images, and axial fluid-attenuated inversion recovery (FLAIR) MRI image obtained at the clinical onset reveal a high-intensity tumefactive lesion with mild perilesional edema in the right frontal lobe. D: Axial post-contrast T1-weighted MRI image obtained at clinical onset shows open ring enhancement. E-G: Axial T2 weighted and coronal FLAIR MRI images obtained on her first admission (2.5 months after the clinical onset) show enlargement of the pre-existing tumefactive lesion and a new hyper-intense lesion in the left basal ganglia. H: Magnetic resonance spectroscopy (MRS) performed on her first admission shows an abnormal elevation of the glutamate/glutamine (Glx) peaks, a decreased N-acetylaspartate (NAA) level, and elevation of the choline (Cho), lipid, and lactate levels. I-L: Axial and coronal FLAIR MRI images obtained on her second admission (9 months after the clinical onset) reveal multiple new tumefactive lesions in the right frontal and temporal lobe. M, N: Axial and coronal FLAIR MRI images obtained 2 weeks after her second admission show new lesions in the right frontal lobe. O, P: Axial T2-weighted and coronal FLAIR MRI images obtained on her third admission (13 months after the clinical onset) reveal a new high-intensity tumefactive lesion in the left temporal lobe. Q-T: Brain biopsy of the tumefactive lesion revealed the characteristic features of active inflammatory demyelination consisting of perivascular lymphocytic infiltration (Q; Hematoxylin and Eosin staining), gliosis of reactive astrocytes (Q), myelin loss (R; Kluver-Barrera), relative axonal preservation (S; neurofilament) and macrophage infiltration (T; CD68). Bars: 100 μm.

