
FIGURE 4.
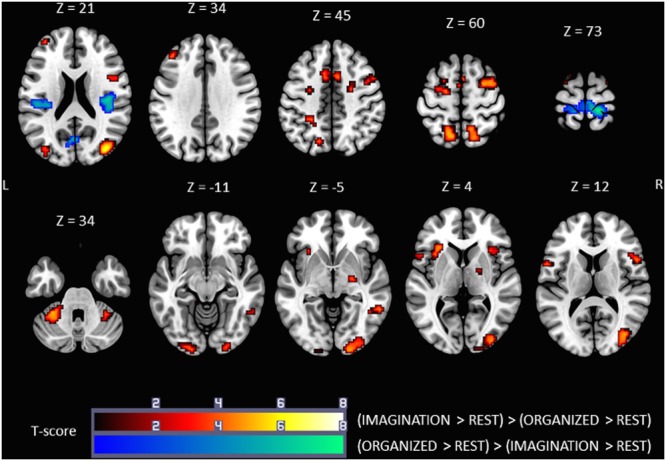
Statistical parametric maps for the (IMAGINATION > REST) > (ORGANIZED > REST) (warm colors) and (ORGANIZED > REST) > (IMAGINATION > REST) (cold colors) contrasts, representing differences in brain activity between gait-like plantar stimulation and mental imagery of gait, p-value threshold of <0.05 FDR-corrected at voxel level with a minimum cluster extent of ten contiguous voxels; images are presented according to neurological convention (R = right, L = left). See text for details.