FIGURE 1.

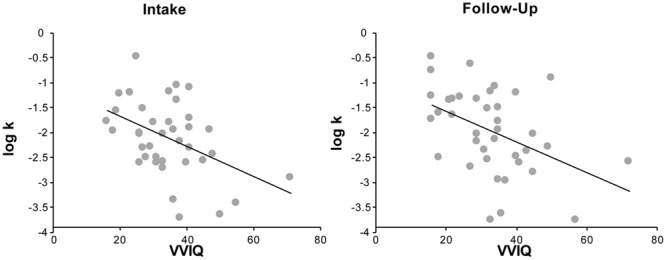
Vividness of Visual Imagery Questionnaire (VVIQ) scores are significantly correlated with log-k values both at intake (n = 48, r = -0.37, p = 0.02) and at follow-up (n = 38, r = -0.45, p < 0.01).

Vividness of Visual Imagery Questionnaire (VVIQ) scores are significantly correlated with log-k values both at intake (n = 48, r = -0.37, p = 0.02) and at follow-up (n = 38, r = -0.45, p < 0.01).