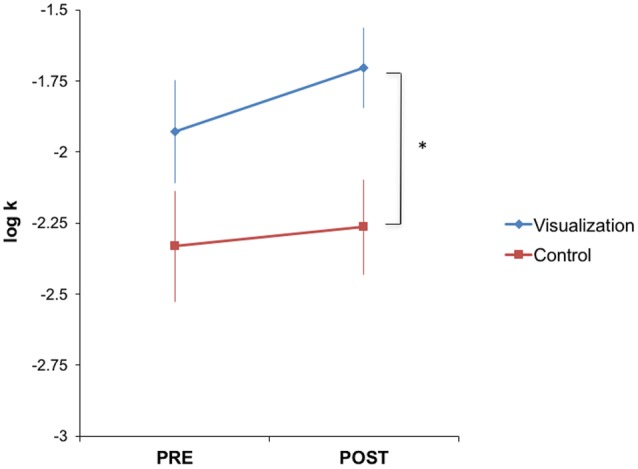
FIGURE 4.

Visualization training tended to increase discounting. The visualization group had significantly higher discount rates (i.e., were more impatient) after training [t(36) = 2.16, p = 0.04], while there was no significant difference between the two groups before training [t(36) = 1.73, p = 0.09]. However, there was no significant effect of training within either group [t(19) = 1.83, p = 0.08 for visualization and t(17) = 1.04, p = 0.31 for control], and the interaction between group and time on discount rates did not reach significance [t(36) = 1.10, p = 0.28]. ∗p < 0.05.
