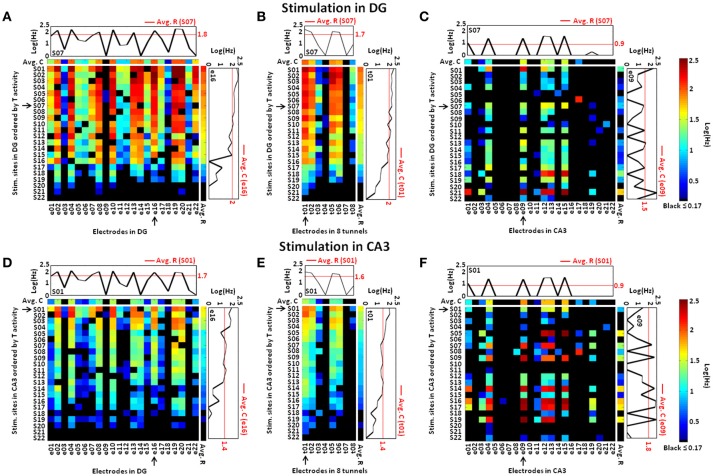
Figure 4.
Stimulation of each site in DG or CA3 activates a more limited set of electrodes sites in CA3 than occurred in DG, suggesting sparse coding of the neural information. (A) Specific stimulation of DG at each site (row) evokes responses in DG transmitted through the tunnels (B) that activate a relatively small set of responses in CA3 (C), suggesting sparse coding. Compared to stimulation of DG, stimulation in CA3 evokes less activity in the DG region (D) and tunnel axons (E), despite higher activity in CA3 (F). Therefore, CA3 stimulation is less effective in driving the axons in the tunnels to activate DG than when DG is stimulated. The rows of each spike rate matrix are ordered according to the spike rates in the tunnels (T) from highest (top) to the lowest (bottom). The log of the averages of the spike rates across recording sites for each stimulus location (i.e., the averages of each row, Avg. R) is shown to the right of the vertical white line in each spike rate matrix. Similarly, the averages across stimulation sites (i.e., the averages of each column, Avg. C) are shown and color coded on a log scale above the horizontal white line. Responses to two particular stimulating electrodes, highlighted by an arrow (S07 in DG, S01 in CA3), are compared to the average for that target electrode. This shows evoked responses either greater or smaller than the average at each recording electrode. Responses at three recordings sites (see arrows at e16 in DG, t01 in the tunnels and e09 in CA3) also show that a single recording electrode reports both upward and downward modulation of spike rates, relative to the average, as the stimulus location changes. This is also consistent with sparse coding in CA3 (C,F) (Array 17210).

