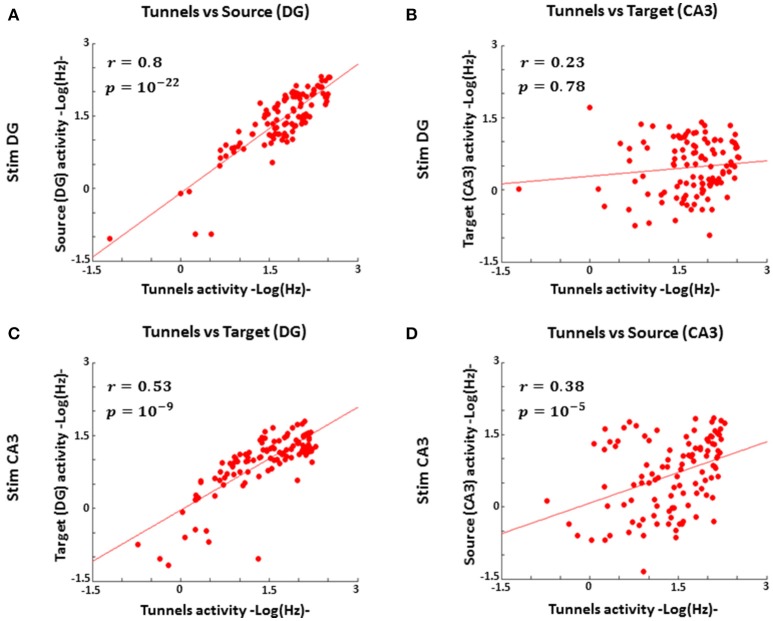
Figure 5.
DG spike rates correlate with tunnel activity during stimulation in DG, but the tunnel input activity to CA3 correlates poorly with CA3 activity, consistent with mass rate coding for DG to tunnels but sparse coding from tunnels to CA3 (n = 5 arrays). (A) Log activity from stimulation in DG strongly correlates with log axon transmission through tunnels (coefficient of correlation r = 0.8, Pearson correlation p = 10−22) (B) During stimulation in DG log activity in CA3 is poorly correlated with log axon transmission through the tunnels (r = 0.23, p = 0.78). (C) Log activity in DG, during stimulation in CA3, is proportional to log axon activity through the tunnels (r = 0.53, p = 10−9), once again indicating a mass action effect. (D) Log activity in CA3 as the source is less effective at driving activity in the tunnels (r = 0.38, p = 10−5).

