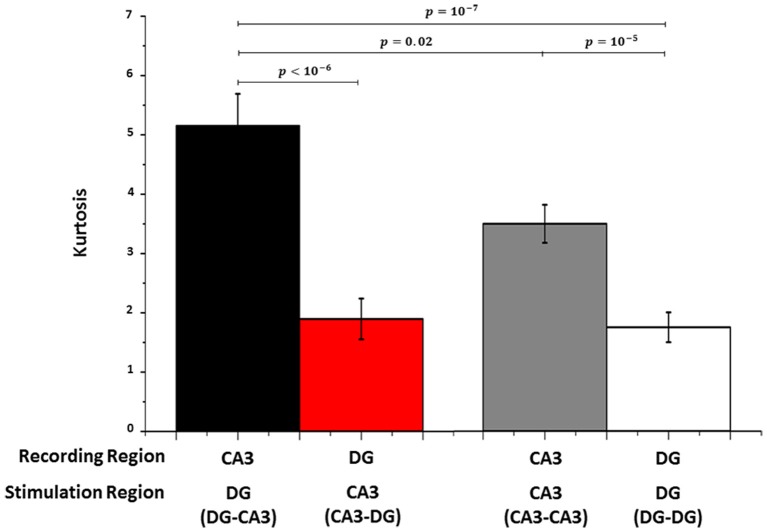
Figure 6.
As a measure of sparseness of spike rate coding, Kurtosis is much larger in CA3 during stimulation in DG (black bar) than DG when CA3 is stimulated (red bar) and the controls (gray bar for CA3 in CA3-CA3 and white bar for DG in DG-DG networks). Wilcoxon rank sum test for n = 5 arrays each.

