Figure 2.
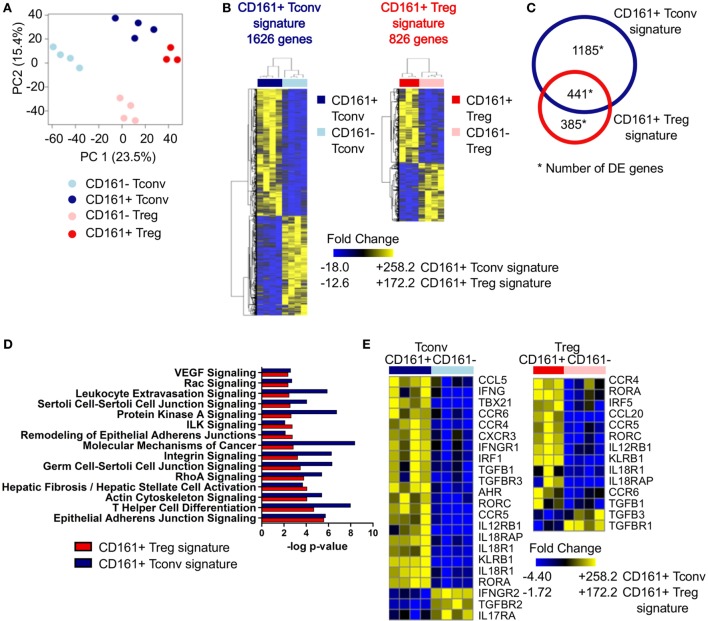
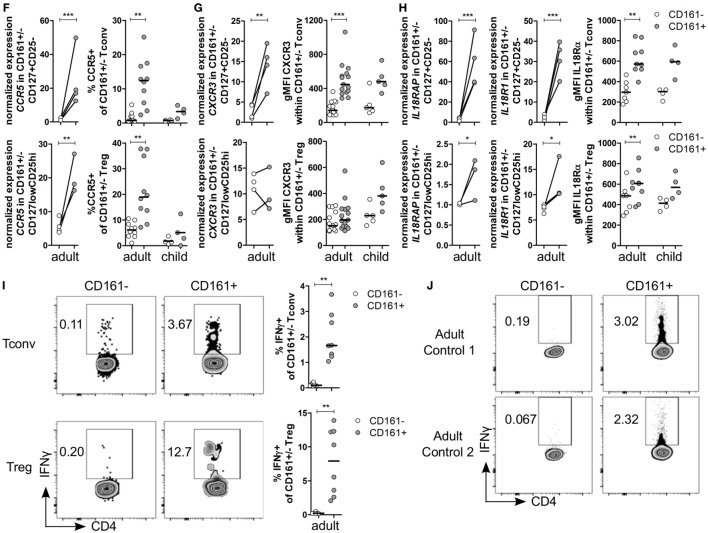
Shared canonical signature between CD161+ conventional T cells (Tconv) and CD161+ regulatory T cells (Treg) reveals a T helper (Th) phenotype of CD161+ T cells. Healthy adult peripheral blood mononuclear cells (PBMC) (n = 4) were sorted into CD4+CD127+CD25−CD161+ (CD161+ Tconv) or CD161− (CD161− Tconv), and CD4+CD127lowCD25hiCD161+ (CD161+ Treg) or CD161− (CD161− Treg) for RNAseq analysis. (A) Principal component analysis (PCA) of data from all samples before applying filters to assess differentially expressed (DE) genes. One CD161+ Treg sample was excluded from analysis due to low cDNA yield. (B) Heat maps of DE genes comparing CD161+ and CD161− Tconv (CD161+ Tconv signature) (1626 DE genes, left), and CD161+ and CD161− Treg (CD161+ Treg signature) (826 DE genes, right). (C) Venn diagram representing overlap in transcriptional signatures of CD161+ Tconv and CD161+ Treg. (D) Canonical pathways altered in both CD161+ Tconv (blue bars) and CD161+ Treg (red bars) signatures identified using ingenuity pathway analysis with −log P-value >2 (equals P-value <0.01). (E) DE genes associated with Th1 and Th17 in CD161+ Tconv and CD161+ Treg compared to CD161− counterparts. (F) Analysis of CCR5 expression; normalized expression values (left, from RNAseq) and percentage CCR5+ cells (right, flow cytometry) within CD161− (○) and CD161+ ( ) Tconv and Treg in healthy adult (n = 10) and child (n = 4) PBMC. (G,H) Analysis of CXCR3 (G) and IL18R (H) expression; normalized expression values (left, from RNAseq) and protein expression (right, flow cytometry) within CD161− (○) and CD161+ (
 ) Tconv and Treg in healthy adult (n = 9–15) and child (n = 4–5) PBMC. (I,J) PBMC (I) or sorted CD161+ and CD161− Tconv (J) from healthy adults were cultured in the presence of 50 ng/ml IL-18 and IL-12 for 24 h with Brefeldin A for last 4 h of culture. (I) Representative plots and summary graphs showing percentage IFNγ+ within CD161− (○) and CD161+ (
 ) Tconv and Treg (n = 8). (J) Representative plots showing IFNγ+ cells within sorted CD161+ and CD161− Tconv from 2 healthy adult controls. Statistical significance: *P < 0.05, **P < 0.01, ***P < 0.001.


