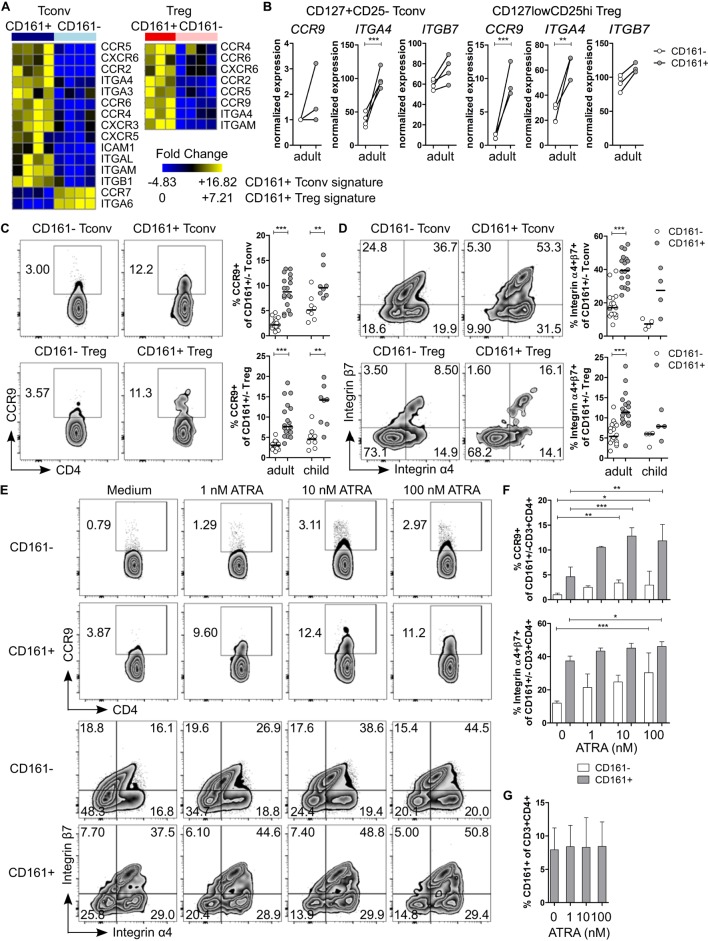
Figure 4.
CD161+ T cells express markers associated with gut homing and respond to all-trans retinoic acid (ATRA). (A) Heat maps showing DE genes encoding chemokine receptors and integrins in CD161+ conventional T cells (Tconv) and CD161+ regulatory T cells (Treg) compared to their CD161− counterparts. (B) Normalized expression values for CCR9, ITGA4, and ITGB7 within CD161− (○) and CD161+ ( ) Tconv and Treg from RNAseq. (C,D) Representative plots and summary graphs showing percentage CCR9+
(C) and integrin α4+β7+
(D) cells by flow cytometry within CD161− (○) and CD161+ (
 ) Tconv and Treg in healthy adults (n = 18) and children (n = 4–8). (E–G) Healthy adult peripheral blood mononuclear cells (PBMC) were cultured in medium, 1, 10, or 100 nM ATRA for 4 days as indicated and analyzed for expression of CCR9, integrin α4β7 and CD161 (n = 6). (E) Representative plots showing percentage CCR9+ and integrin α4+β7+ cells within CD161+ and CD161− CD3+CD4+ T cells at culture conditions indicated. (F) Summary graphs showing percentage CCR9+ and integrin α4+β7+ cells within CD161− (○) and CD161+ (
 ) CD3+CD4+ T cells at culture conditions indicated. (G) Percentage CD161+ cells within CD3+CD4+ cells at end of culture. (H,I) Purified CD161+ and CD161− Tconv from healthy adults were cultured with ATRA as described before (n = 3). (H) Summary graphs showing percentage CCR9+ and integrin α4+β7+ cells within sorted CD161− (○) and CD161+ (
 ) Tconv at culture conditions indicated. (I) Percentage CD161+ cells of CD3+CD4+ cells within sorted CD161− (○) and CD161+ (
 ) Tconv at end of culture. Statistical significance: *P < 0.05, **P < 0.01, ***P < 0.001.


