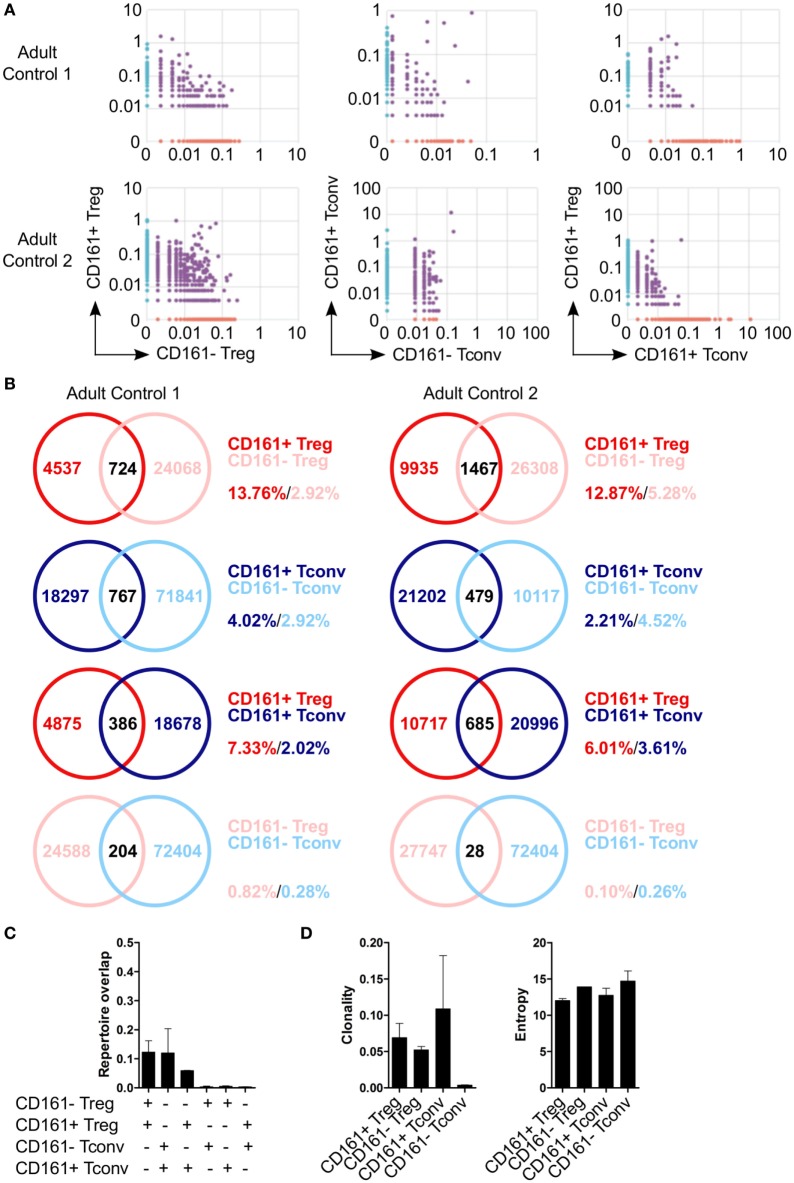
Figure 5.
Limited overlap in TCRβ repertoire between CD161+ and CD161− conventional T cells (Tconv) and regulatory T cells (Treg) from peripheral blood. Sorted CD161+ and CD161− Tconv and Treg from two healthy adults were analyzed for TCRβ repertoire by TCRB CDR3 VDJ sequence analysis. (A) Pair-wise comparison plots showing average productive frequency of shared (purple) and unique clones (on x- or y-axis) at nucleotide level between the different cell populations as indicated. (B) Venn diagrams showing number of shared and unique TCR sequences between the cell populations as indicated. Frequencies indicate percentage of unique sequences shared between the two repertoires divided by total sequences for that cell population. (C) Summary graph depicting repertoire overlap between different cell populations and was calculated as followed: shared sequences by samples A and B divided by total sequences in samples A and B. (D) Summary graphs for clonality and entropy (Shannon entropy) of the sorted cell populations.

