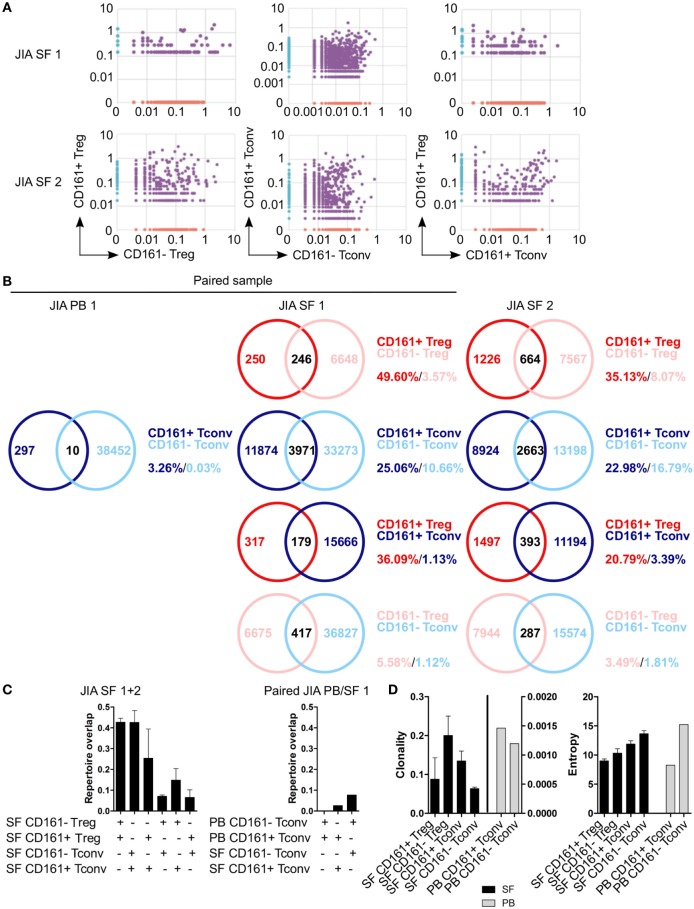
Figure 8.
CD161+ and CD161− conventional T cells (Tconv) and regulatory T cells (Treg) from the inflamed site show sharing of TCRβ repertoires. Purified CD161+ and CD161− Tconv and Treg from juvenile idiopathic arthritis (JIA) synovial fluid (SF) (n = 2) and CD161+ and CD161− Tconv from JIA peripheral blood (PB) (n = 1) were analyzed for TCRβ repertoire. Sample JIA PB/SF 1 is a paired sample whereas JIA SF 2 is not. (A) Pair-wise comparison plots showing average productive frequency of shared (purple) and unique clones (on x- or y-axis) between the different cell populations from JIA SF as indicated. (B) Venn diagrams showing number of shared and unique TCR sequences between the cell populations from JIA PB/SF as indicated. Frequencies indicate percentage of unique sequences shared between the two repertoires divided by total sequences for that cell population. (C) Summary graphs depicting repertoire overlap (calculated as followed: shared sequences by samples A and B divided by total sequences in samples A and B) between indicated cell populations from JIA SF only (left, n = 2), and CD161− and CD161+ Tconv from paired JIA PB/SF 1 (right, n = 1). (D) Summary graphs for clonality and entropy (Shannon entropy) for cell populations from JIA SF (black bars, n = 2) and JIA PB (gray bars, n = 1).

