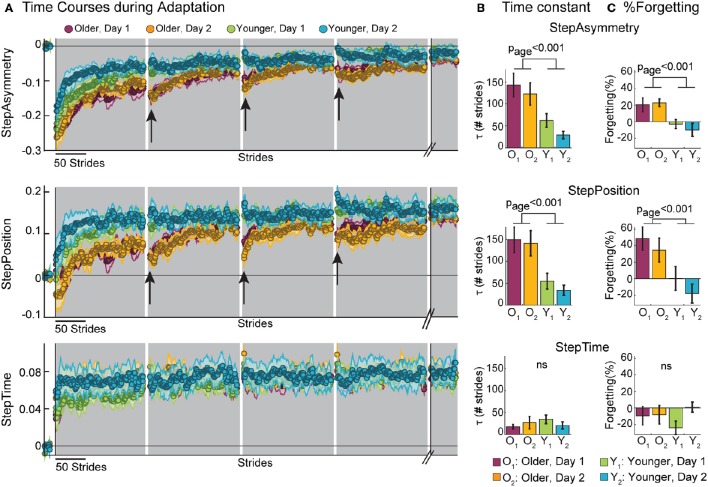
Figure 2.
Early Adaptation Behavior. (A) Stride-by-stride time courses during baseline and adaptation for StepAsym, StepPosition, and StepTime are shown. Shaded gray areas represent the adaptation period. Resting breaks, when subjects were not walking, are indicated by the white regions in between shaded areas. The last 50 strides of the second adaptation block (before subjects walk overground) are also shown. Black arrows indicate the decays in adapted state due to the passage of time during the resting breaks. Colored dots represent the average of 5 consecutive strides and colored shaded regions indicate the standard error for each group. (B) Bar plots indicate the mean time constants (i.e., τ) per group ± standard errors and statistical difference lines between groups illustrate significant ANOVA effects of age. Remember that a large τ indicates that subjects slowly adapted. Note that, on average, subjects' time constants are <150 strides indicating that they occurred before the first resting break. (C) Bar plots indicate the mean %Forgetting per group ± standard errors and statistical difference lines between groups illustrate significant ANOVA effects of age.

