
Figure 7.
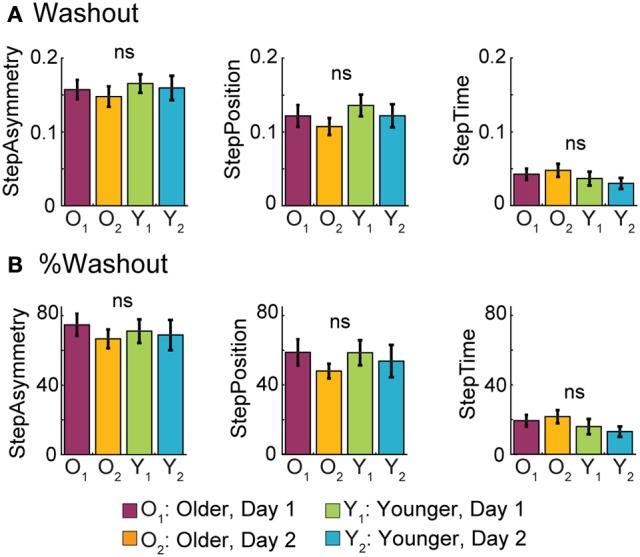
Washout of Split-belt After-effects Following Overground Walking. (A) Bar plots indicate the mean Washout values per group ± standard errors. These quantify the initial after-effects when returning to the treadmill after overground walking. (B) Bar plots indicate the mean %Washout values per group ± standard errors. %Washout values indicate the amount of remaining after-effects on the treadmill as a percent of AdaptExtent during the split-belt condition. In other words, %Washout values takes into account how well subjects adapted their gait on the treadmill. %Washout values of 100% indicate that the adapted movements on the treadmill remain intact after the overground walking experience.