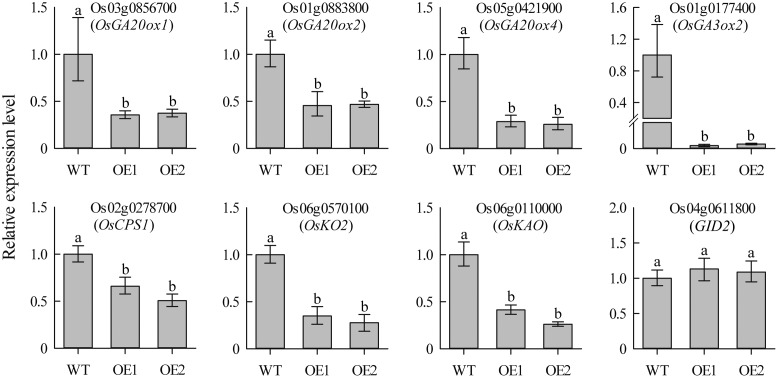
FIGURE 6.
Real-time PCR analysis of GA biosynthesis genes in leaves of 2-week-old seedlings. Each PCR assay was run in duplicate for each of three independent biological replicates. Values represent means of n = 6 ± SD and different letters above the columns indicate significant differences from the corresponding WT at the p < 0.01 level.

