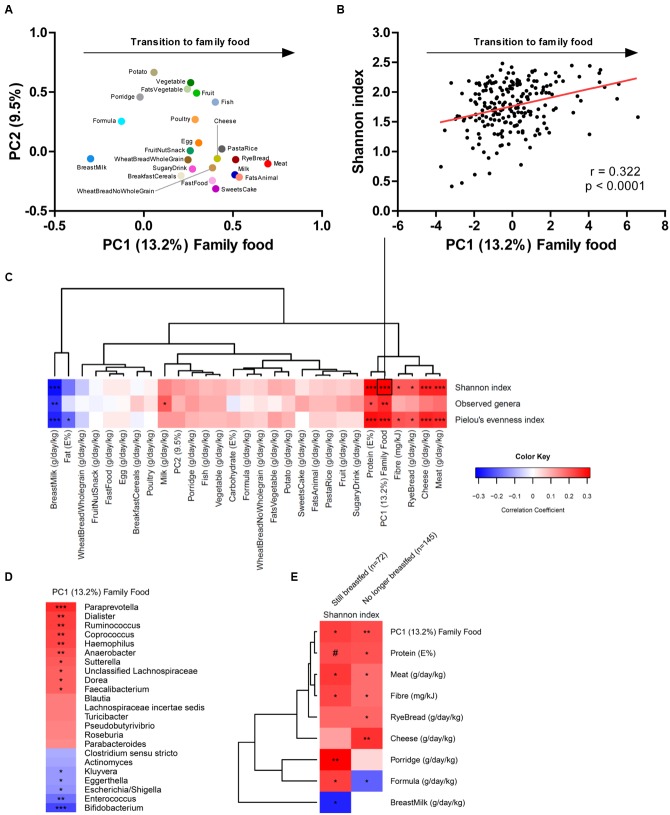
FIGURE 1.
(A) PCA loading plot of the 23 food groups (grams per day per kilogram body weight), with the fist principal component defined as family food, describing the transition from early infancy foods to family foods. (B) Pearson’s correlation between family food and the Shannon index of alpha diversity. (C) Heatmap illustrating hierarchical clustering of correlation coefficients between dietary parameters and alpha diversity metrics. (D) Heatmap illustrating correlation coefficients between family food and gut microbial genera showing a p-value below 0.1. (E) Heatmap illustrating hierarchical clustering of correlation coefficients between dietary parameters and Shannon index in partially breastfed (n = 72) and weaned (n = 145) infants aged 9 months. Color key applies to panel (C–E) and represents correlation coefficients of Spearman’s rank/Pearson’s correlations. Statistical significance is indicated by #p = 0.05, ∗p < 0.05, ∗∗p < 0.01, ∗∗∗p < 0.001. The figure is based on previously published data (Laursen et al., 2016).

