Figure 1.
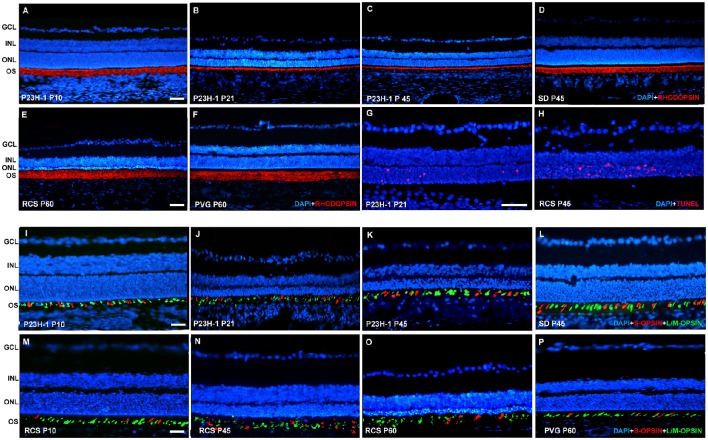
Rhodopsin and opsin expression in control SD and PVG rats and P23H-1 and RCS rats. Photomicrographs of representative retinal cross sections taken from the mid-dorsal retina of control SD (D,L) and PVG (F,P) and P23H-1 (A–C,I–K) and RCS (E,M–O) rats showing rhodopsin immunoreactivity (red) and DAPI-counterstaining (blue; A–F), S- (red) and L/M- (green) opsin immunoreactivity and DAPI-counterstaining (blue; I–P) or TUNEL labeling of photoreceptors (red) and DAPI-counterstaining (blue; G,H). In P23H-1 rats the expression of rhodopsin is already affected at P10 (A, compare to D), and decreases further until P45, the latest time analyzed (B,C). At P10 the cone outer segments look normal (I, compare to L) but show degeneration signs at P21 and P45 (J,K). In RCS rats rhodopsin expression did not change at any of the time points studied (E, compare to F). The outer segments of cones look normal at P10 (M, compare to P) but at P45 and P60 (N,O) they are degenerated. TUNEL staining reveals abundant photoreceptor apoptosis during retinal degeneration in P23H-1 and RCS rats (G,H). Scale bar = 100 μm.

