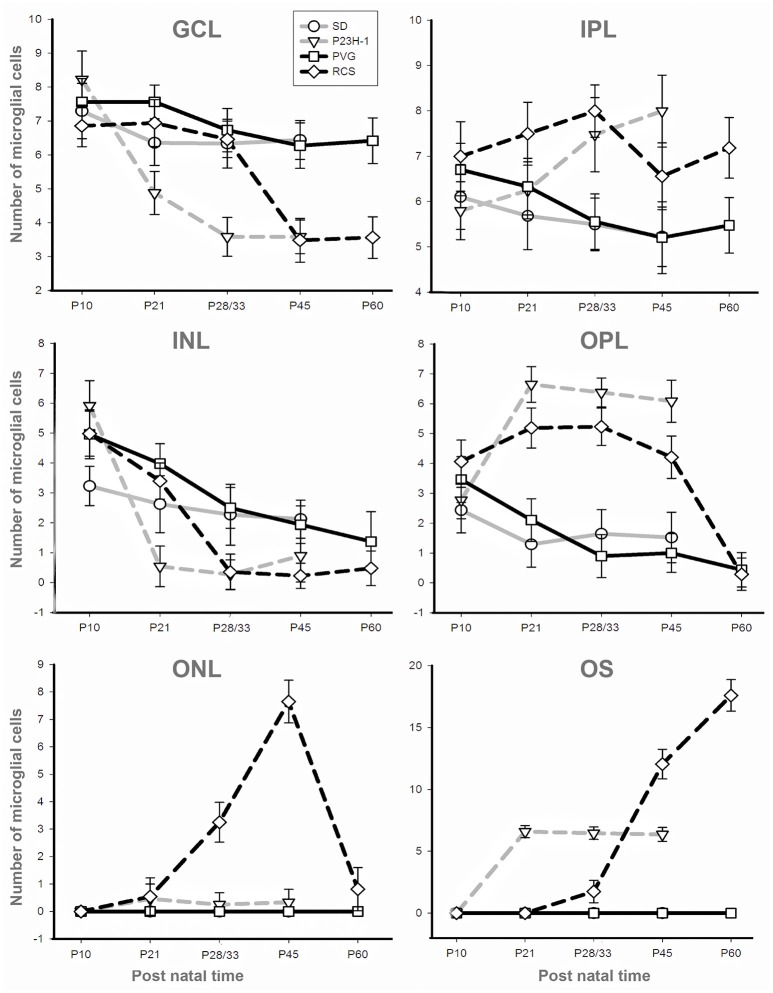
Figure 4.
Numbers of microglial cells in the different retinal layers. Mean numbers (±SD) of microglial cells counted in each retinal layer at the different ages analyzed in SD rats (gray solid), P23H-1 rats (gray interrupted), PVG rats (black solid), and RCS rats (black interrupted; see also insert). Control animals show sustained numbers of microglial cells in the inner retinal layers, decreasing numbers in the INL and OPL and absence of microglial cells in the ONL and OS layer. Dystrophic animals show decreasing numbers of microglial cells in the GCL and INL and increasing numbers in the OPL and OS layer. Dystrophic animals show a striking difference in the ONL: the number of microglial cells increase in RCS rats but are almost absent in P23H-1 rats.

