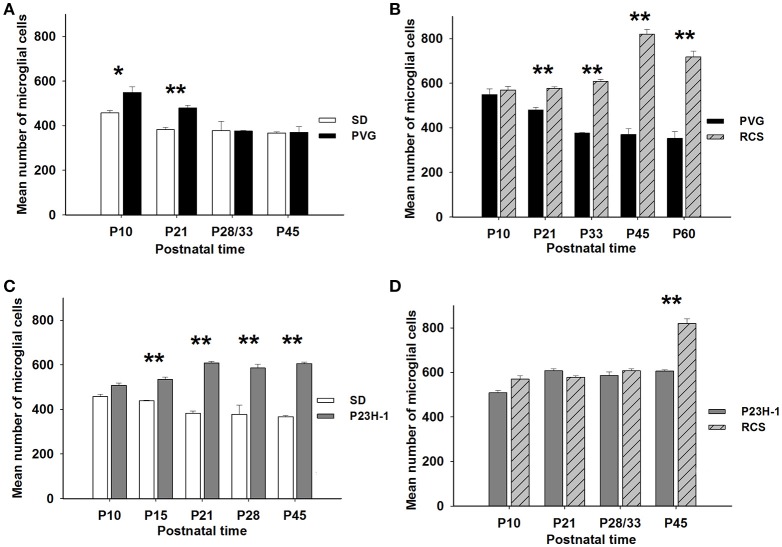
Figure 5.
Numbers of microglial cells in control and dystrophic animals. Mean numbers (±SD) of microglial cells per group of animals at different postnatal ages and comparison between control SD and PVG rats (A), between pigmented animals: RCS vs. PVG (B), between albino animals: P23H-1 vs. SD (C), and between dystrophic animals: P23H-1 vs. RCS (D). Differences statistically significant at the same postnatal age *p ≤ 0.01 and **p ≤ 0.001. PVG rats have significantly more microglial cells at P10 and P21 (A), RCS and P23H-1 rats have significantly more microglial cells than their control PVG and SD rats at all postnatal ages except P10 (B,C) and RCS rats have more microglial cells than P23H-1 rats only at P45 (D).

