Figure 2.

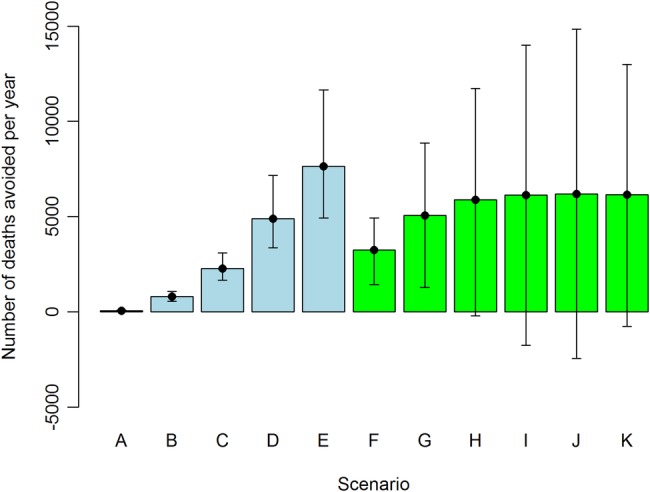
Avoidable deaths per year (mean and 95% credible interval) in England for different scenarios. See table 2 for description of scenarios and online supplementary table S4 for numerical values.

Avoidable deaths per year (mean and 95% credible interval) in England for different scenarios. See table 2 for description of scenarios and online supplementary table S4 for numerical values.