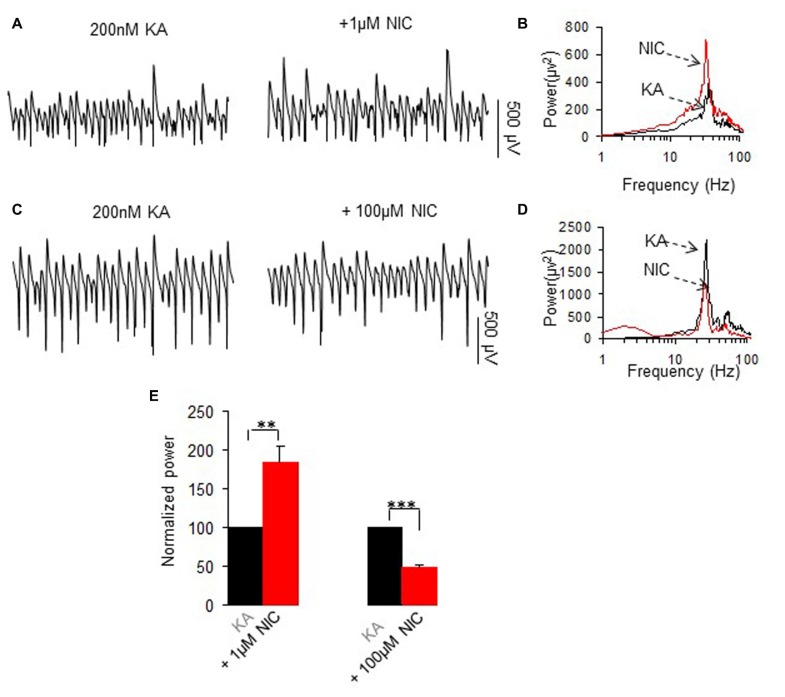
Figure 1.
The effects of two concentrations of nicotine on kainate-induced γ oscillations. (A,C) Field potential recordings from the CA3 stratum pyramidale, before (the trace was taken at a time point that γ oscillation was stable for 60 min after kainate application) and after application of 1 μM nicotine (30 min after nicotine; A) or 100 μM nicotine (30 min after nicotine; C). (B,D) The power spectra corresponding to (A,C). (E) γ power as % of baseline γ power for 1 μM nicotine (n = 13) and 100 μM nicotine (n = 12, **P < 0.01, ***P < 0.001, one way repeated measures (RM) ANOVA, compared with control γ power).

