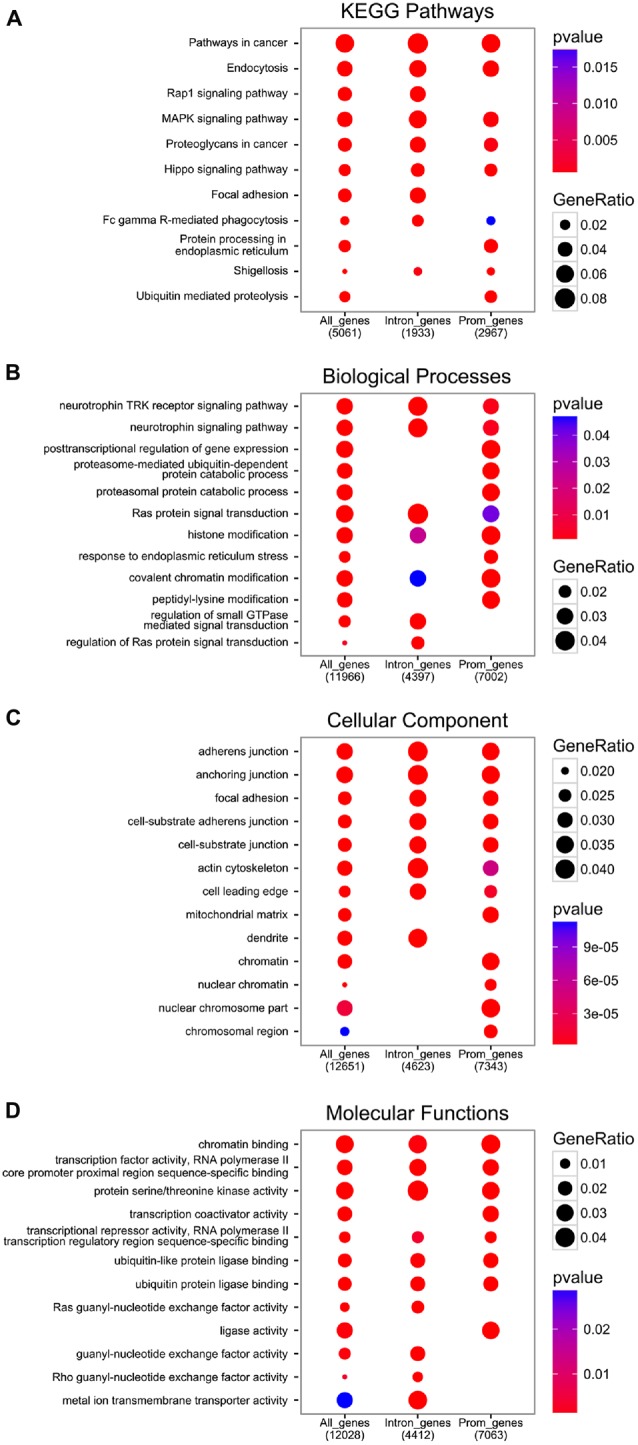
Figure 3.

Functional analysis of EGR1 targets from the encyclopedia of dna elements (ENCODE) datasets. All genes annotated near an EGR1 peak (“All_genes”), or those with at least one EGR1 peak called within their promoter region (3 kb around transcription start site (TSS), “Prom_genes”), or within their intronic region (“Intron_genes”), were functionally annotated with the Kyoto Encyclopedia of Genes and Genomes (KEGG) database (A) and the gene ontology database distinguishing between the biological processes (B) cellular component (C) and molecular functions (D) domains with the Bioconductor package ChIPSeeker (v1.8.9; Yu et al., 2015).
