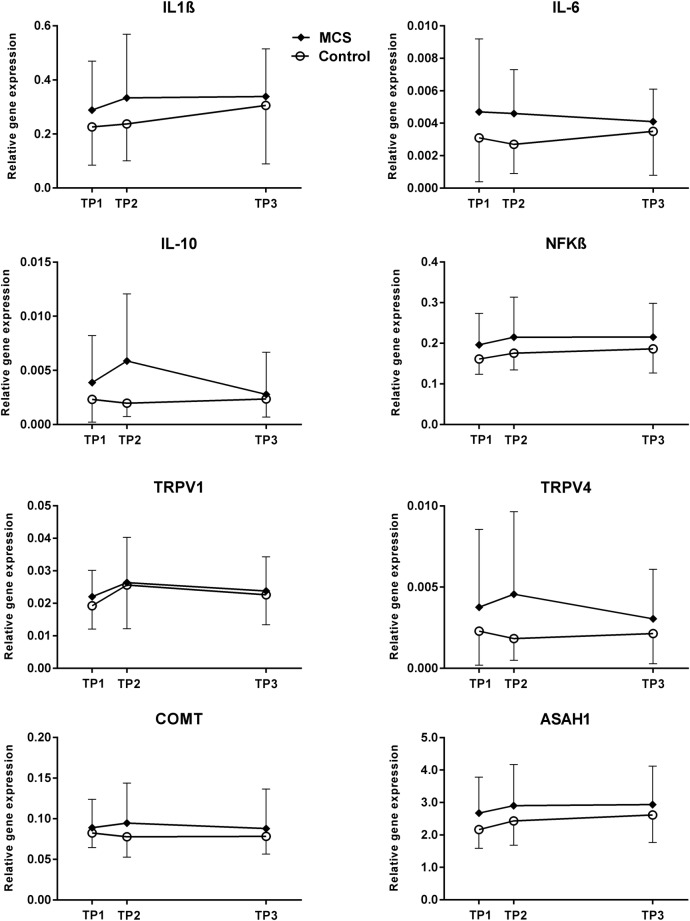
Figure 3.
n-Butanol exposure and relative gene expression levels. Data are shown as mean levels with SD of IL-1β, IL-6, IL-10, NFKB, TRPV1, TRPV4, COMT and ASAH1 quantified in buffy coat samples from the MCS participants and control. Data is presented at each of the three TPs of sampling: within 30 min prior to the exposure (TP1), within 15 min postexposure (TP2) and 4 hours after the exposure session had been terminated (TP3). ASAH1, N-acylsphingosine amidohydrolase (acid ceramidase) 1; COMT, catechol-O-methyltransferase; IL, interleukin; MCS, multiple chemical sensitivity; NFKB1, nuclear factor of κ light polypeptide gene enhancer in B cells 1; TP, time point; TRPV1, transient receptor potential cation channel, subfamily V, member 1; TRPV4, transient receptor potential cation channel, subfamily V, member 4.

