FIGURE 2.

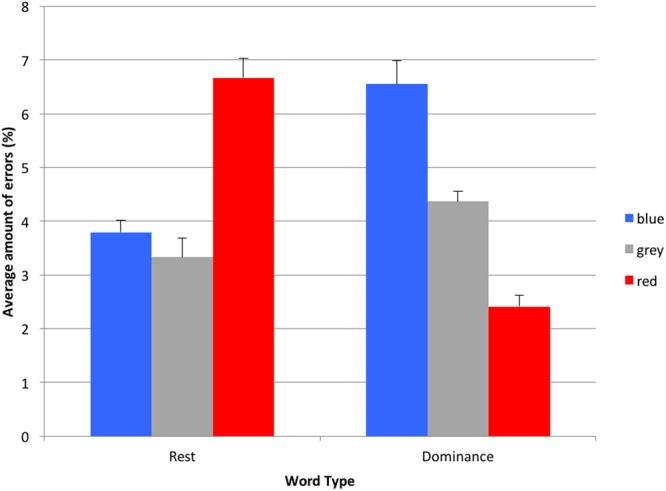
Average amount of errors for dominance or rest words shown in red, blue, or gray (error bars indicate 1 standard error of each respective mean).

Average amount of errors for dominance or rest words shown in red, blue, or gray (error bars indicate 1 standard error of each respective mean).