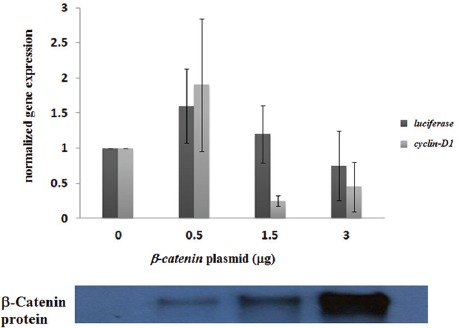
Figure 4.

RT-PCR experiments were performed to measure the expression of the cyclin D1 and luciferase genes in HEK293T cells transfected with varying amounts of the β-catenin plasmid. To measure the luciferase gene, we also transfected the cells with 0.5 μg of the reporter, TOP Flash plasmid. The chart represents the average of gene expression for 3 independent experiments. The gene expression level was significantly different between the groups evaluated by the ANOVA test (P=0.01). The result of a western blot experiment measuring the corresponding β-catenin protein levels is shown below the chart.
