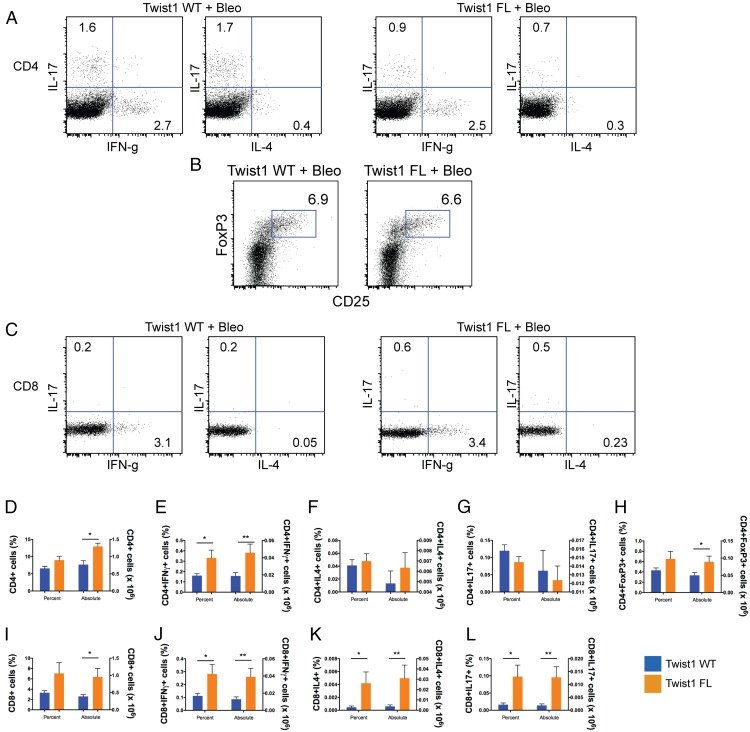
FIGURE 3.
Subphenotyping of T cells from bleomycin-injured Twist1 FL and WT mice. Flow cytometry of single-cell suspensions of bleomycin-injured Twist1 WT or Twist1 FL mouse lungs to describe the T cell subphenotypes following stimulation and intracellular cytokine staining is as described in Materials and Methods. (A) Dot plots for CD4+ IFN-γ, IL-4, and IL-17 from bleomycin-injured Twist1 WT and Twist1 FL animals. (B) Dot plot for CD4+Foxp3+ cells. (C) Dot plots for CD8+ IFN-γ, IL-4, and IL-17. Percentage of cells (left y-axis) and the absolute numbers of cells (right y-axis) are reported, n = 8 per condition, and data were analyzed by an unpaired t test. (D) CD4 (*p = 0.003). (E) CD4 plus IFN-γ (*p = 0.04, **p = 0.02). (F) CD4 plus IL-4. (G) CD4 plus IL-17. (H) CD4 plus Foxp3 (*p < 0.05). (I) CD8 (*p = 0.04). (J) CD8 plus IFN-γ (*p = 0.04, **p = 0.03). (K) CD8 plus IL-4 (*p < 0.05, **p = 0.05). (L) CD8 plus IL-17 (*p < 0.03, **p = 0.02).

