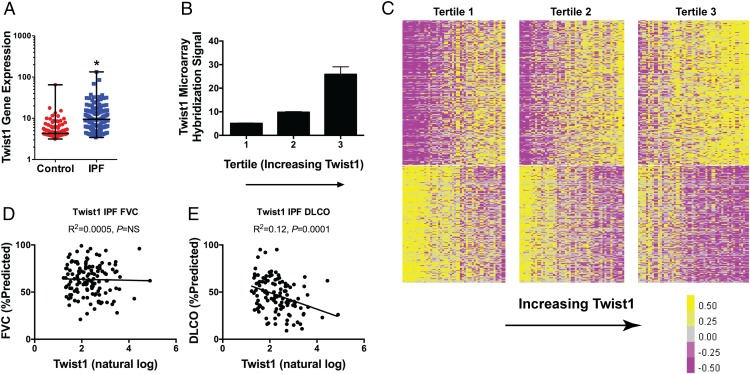
FIGURE 8.
Twist1 gene expression is increased in IPF and, among IPF patients, negatively correlates with DLCO in IPF and is associated with a distinct gene expression profile. (A) Twist1 gene expression was measured in IPF patients (n = 134) and control patients (n = 107). Gene expression was 2.3-fold higher in IPF (*p < 0.0001, by unpaired t test). (B) IPF patients were organized into three tertiles based on increasing expression of Twist1 (p = 0.003 for trend by one way ANOVA, n = 44–45 per tertile). (C) Heat map of differentially expressed genes in IPF patients based on Twist1 expression. Each column represents a patient, and each row represents a gene. Between the lowest and the highest tertiles, 387 genes are differentially expressed. (D) FVC (percent predicted) and (E) DLCO (percent predicted) as a function of natural log-transformed Twist1 gene expression.

