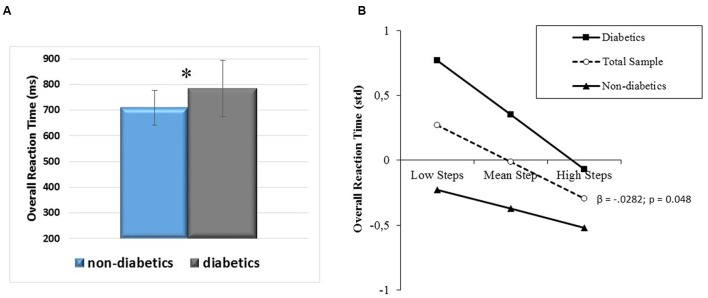
FIGURE 8.
(A) Overall RT differences between diabetic and non-diabetic aging individuals (mean ± SD) and (B) prediction of overall RT accrued by PA level (daily steps) independently of diabetic/non-diabetic status. Solid lines: change in the slope of the predictor for diabetic vs. non-diabetic aging individuals; β values and their significance are reported for the main slope (dotted line) of the non-moderated prediction. ∗p < 0.05.

