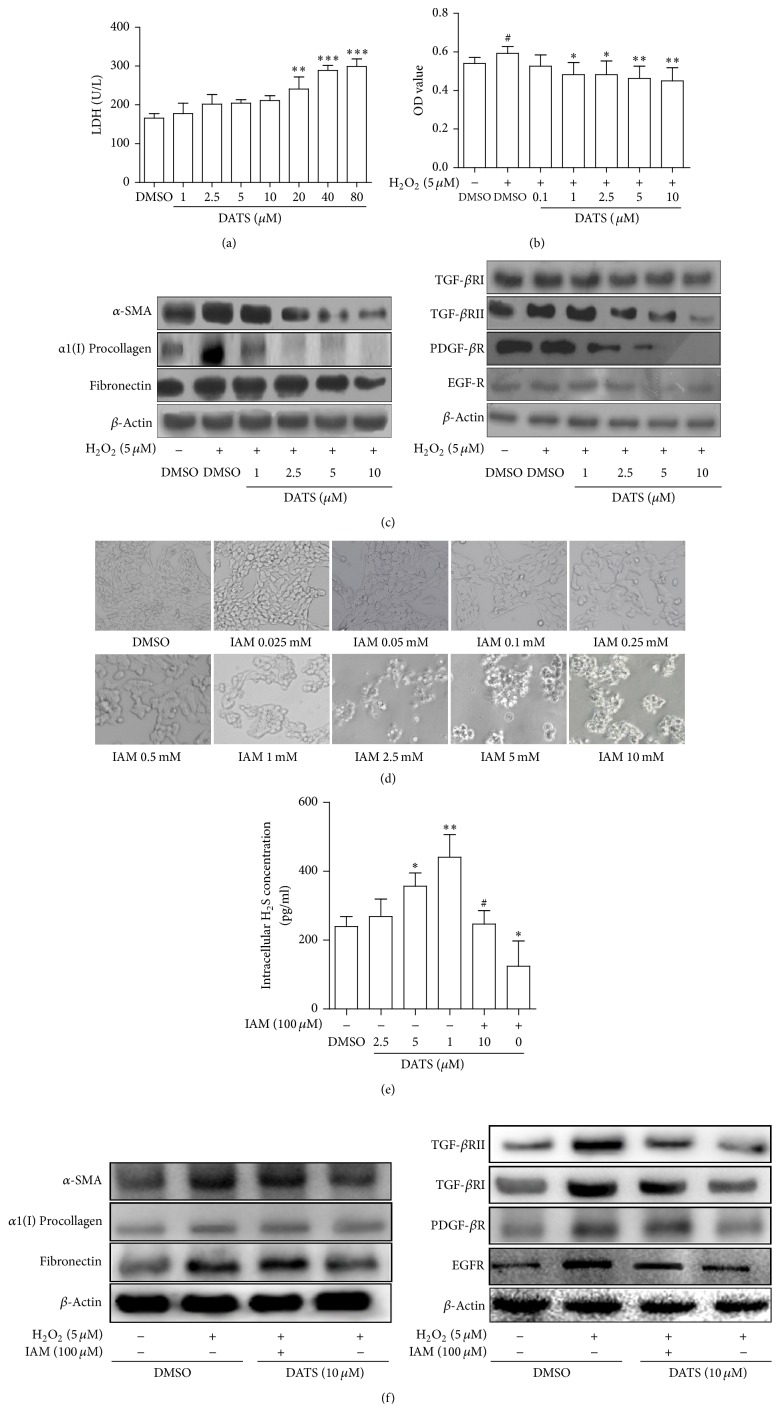
Figure 1.
DATS inhibits viability and reduces fibrotic protein expression associated with H2S in HSCs. (a) LDH release assay. Significance: ∗∗P < 0.01 versus DMSO and ∗∗∗P < 0.001 versus DMSO. (b) MTT assay. Significance: #P < 0.05 versus DMSO, ∗P < 0.05 versus DMSO + H2O2, and ∗∗P < 0.01 versus DMSO + H2O2. (c) Western blot analyses of profibrotic marker proteins. (d) Morphology evaluation with light microscope (200x magnification). (e) ELISA for H2S concentration. Significance: ∗P < 0.05 versus DMSO, ∗∗P < 0.01 versus DMSO, and #P < 0.05 versus DATS 10 μM. (f) Western blot analyses of profibrotic marker proteins.

