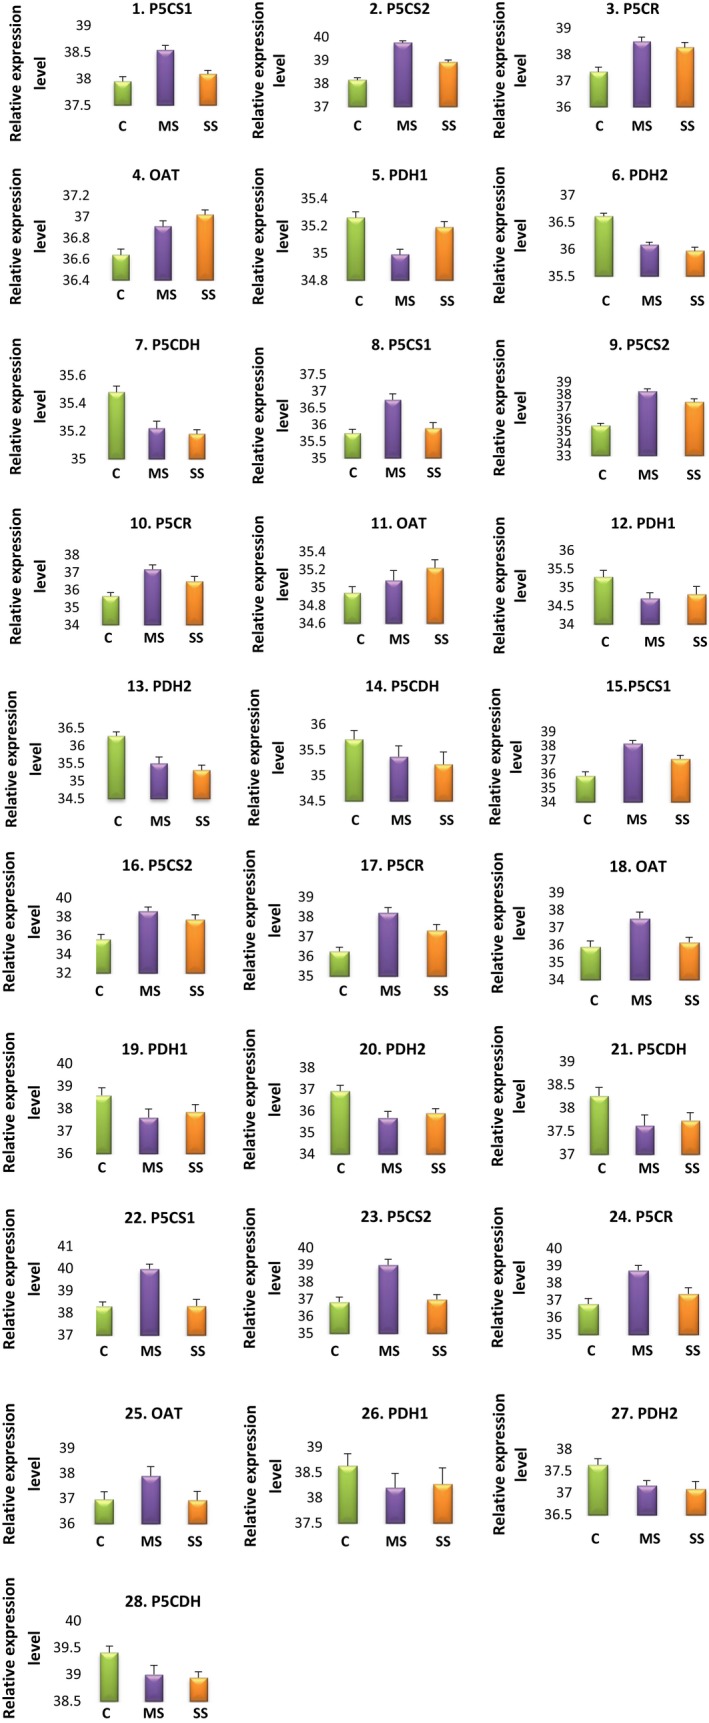
Figure 3.

Relative quantification plot of proline metabolic genes among the control (C), moderately stressed (MS), and severely stressed (SS) A. annua plants at different developmental stages. 1–7, early vegetative stage; 8–14, late vegetative stage; 15–21, preflowering stage; 22–28, flowering stage. The expression levels of mRNAs were normalized to the level of GAPDH and given on a logarithmic scale expressed as 45‐∆CT, where ∆CT is the difference in real‐time PCR threshold cycle number of the respective gene and the reference gene, where 45 equals the expression level of GAPDH gene (the number 45 was chosen because the PCR run stops after 45 cycles). The results are averages ± SE of duplicates of three samples.
