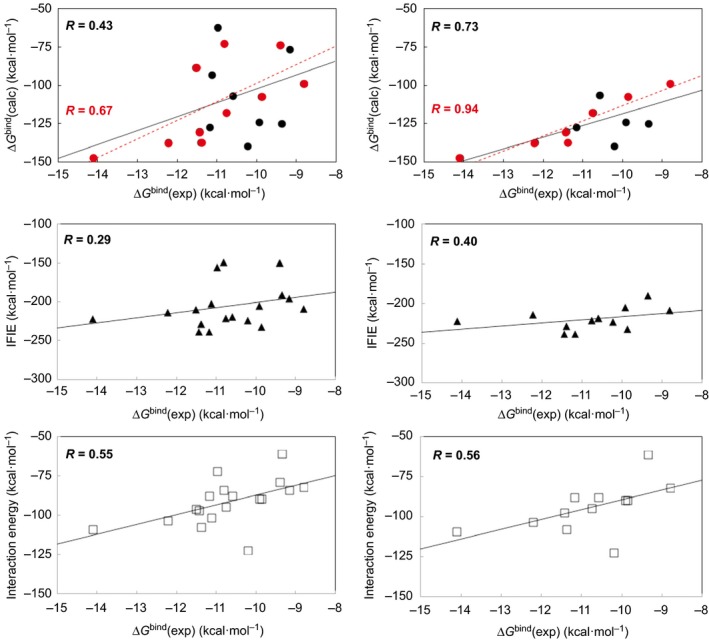
Figure 2.

Correlations between ΔG bind(exp) 15 and ΔG bind(calc) (circles), IFIE (triangles), and interaction energies of the most stable complex obtained from the docking simulations (squares) for the binding of the α, β, and γ subtypes of hRXR and hRAR LBDs with ATRA, 9cRA, Am80, and LGD1069. Left‐hand side shows the correlation diagram for all six receptors. Right‐hand side shows the correlation diagram for hRXRα, hRXRβ, hRARβ, and hRARγ LBDs. At the top, red color represents the correlation for ATRA and 9cRA.
