Figure 3.

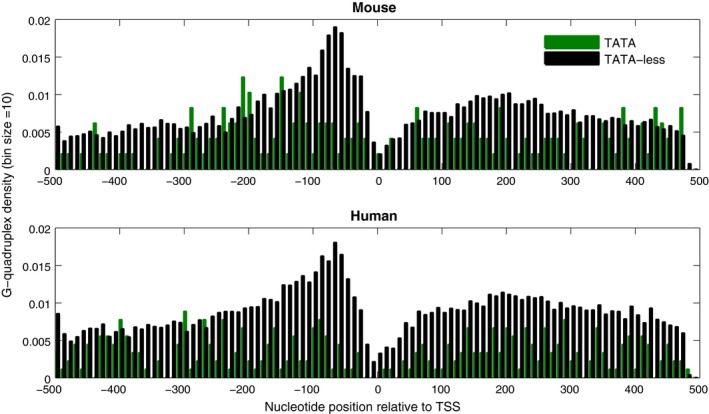
Positional distribution of G‐quadruplex motifs in TATA‐containing and TATA‐less promoter regions of mouse and human. The regular expression G3−5N1−7G3−5 N1−7G3−5N1−7G3−5 or C3−5 N1−7C3−5 N1−7C3−5N1−7C3−5 is searched in −500 to +500 region relative to TSS and summed for each 10 nucleotide bin. To compare the two classes of promoters, G‐quadruplex motif density has been calculated by dividing the total number of promoters in each bin, which contains a G‐quadruplex motif, by the number of promoter sequences in each class. TATA‐less promoters of mouse and human are enriched with G‐quadruplexes in the vicinity of TSS, as compared to TATA‐containing promoters.
