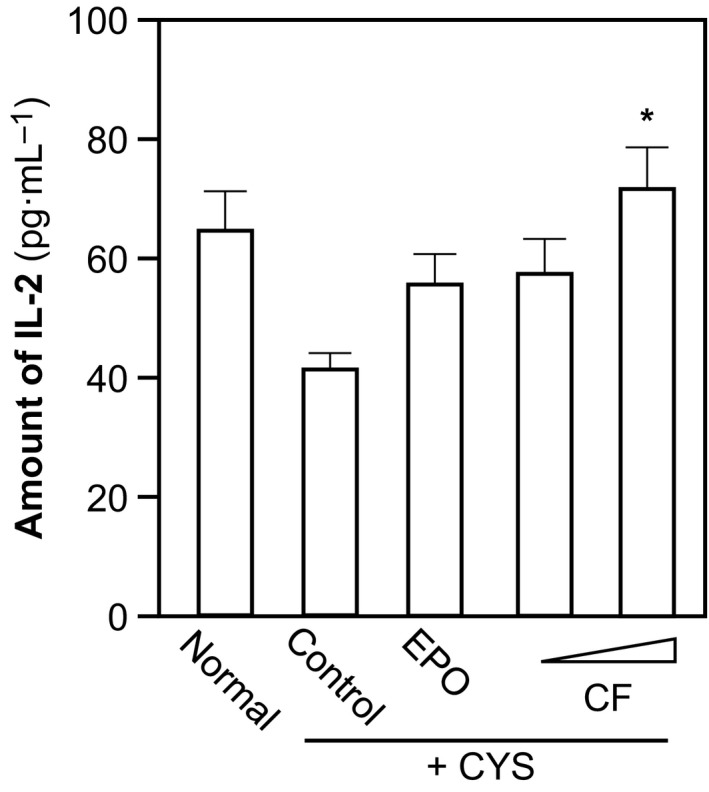
Figure 3.

Combined flavonoids on serum level of IL‐2. The treatment of anemic rats, as well as the grouping, was carried out as in Fig. 1. The amount of IL‐2 was measured by ELISA. Data are expressed as Mean ± SD, where n = 6–8. [*] where P < 0.05 as compared with control group.
