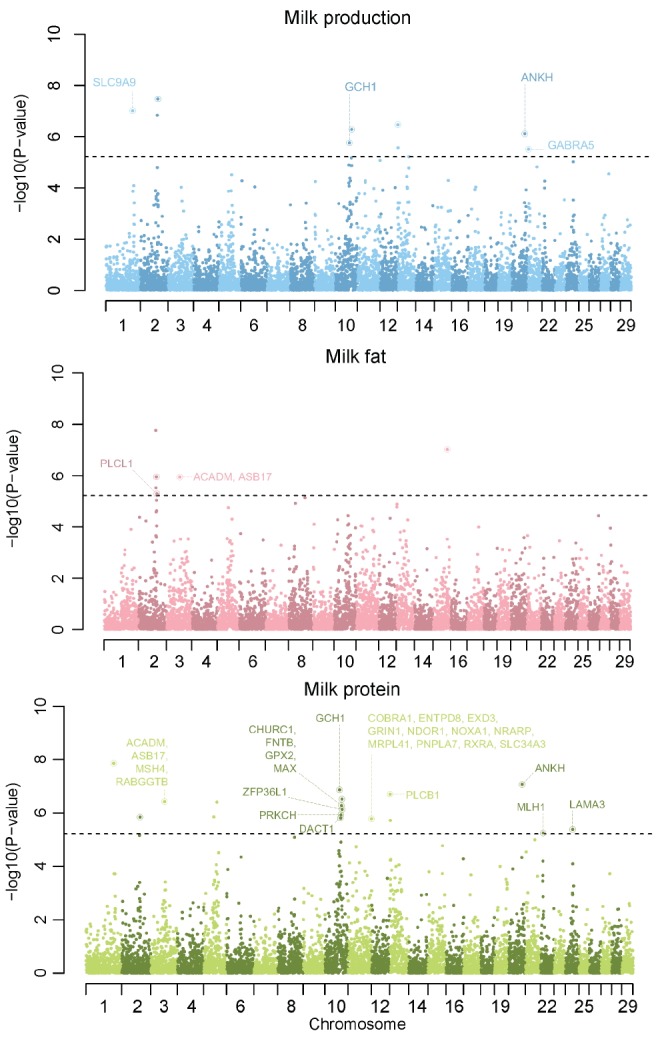
Figure 1.

Manhattan plot of genome-wide association studies (GWAS) result of each milk traits after p-value integration. Each circle indicated each region containing 5 single nucleotide polymorphism (SNP) and circle with ring meant that region contained nearby gene. We provide the gene names which were significant in both GWAS and gene ontology analysis. a) milk production, b) milk fat, and c) milk protein. Grey dot line indicates the threshold of Bonferroni multiple test based on integrated p-values in each milk traits association test (genomic p-value<6.09E-06, equivalent to p-value = 0.05 after Bonferroni multiple correction).
