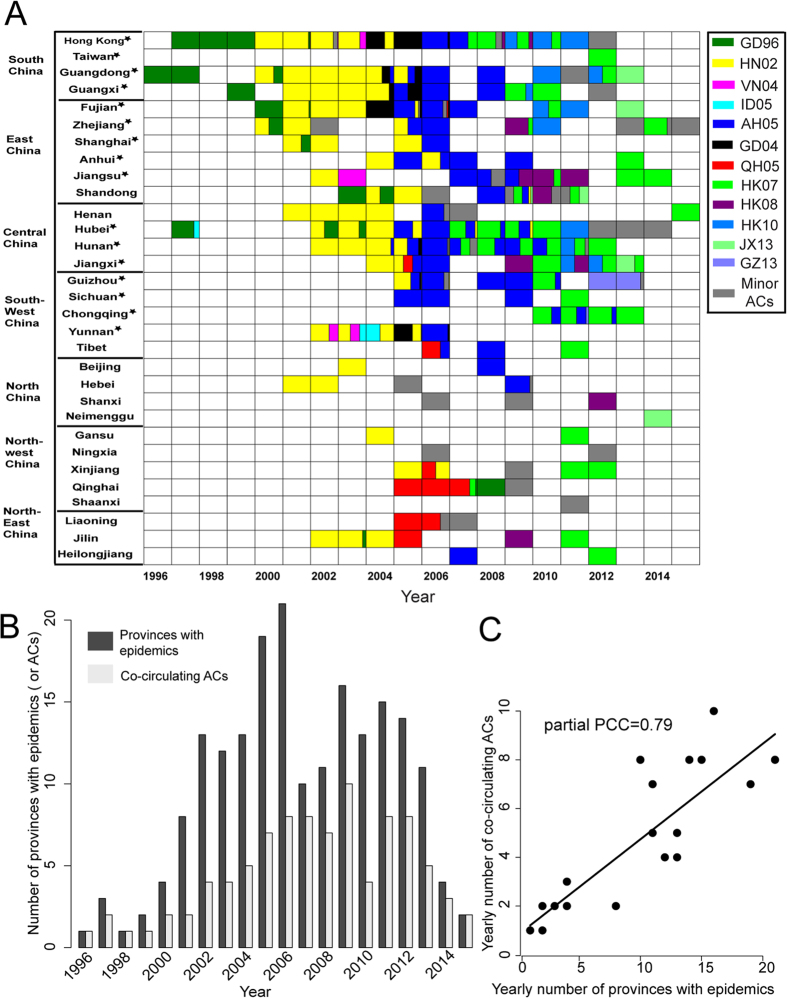
Figure 4. Translocation of antigenic types of HPAI H5N1 virus in China.
(A) Tempo-spatial dynamics of ACs within China, showing dynamic changes in the fraction of ACs (colored as in Fig. 2) recorded on a yearly basis for each province. White indicates no virus is isolated in that province in that year. (B) The number of provinces with epidemics (dark gray) and co-circulating ACs (light gray) between 1996 and 2015. (C) The partial Pearson Correlation Coefficient (PCC) indicating the correlation between the number of province with epidemics and co-ciruclating ACs after controlling for the influence of the number of HA sequences per year.

