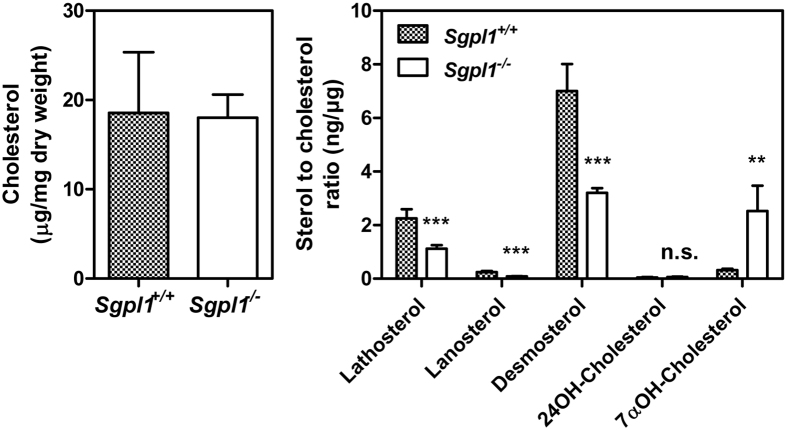
Figure 3. Cellular levels of cholesterol, non-cholesterol sterols and oxysterols.
The measurements were performed by GC-flame ionization detection for cholesterol and GC-mass spectrometry detector-selected ion monitoring for sterols and oxysterols except cholesterol in MEFs that had been kept in 0.3% FCS. The values are means ± SD, n = 4. **p < 0.01; ***p < 0.001; n.s., not significant in t-test.

