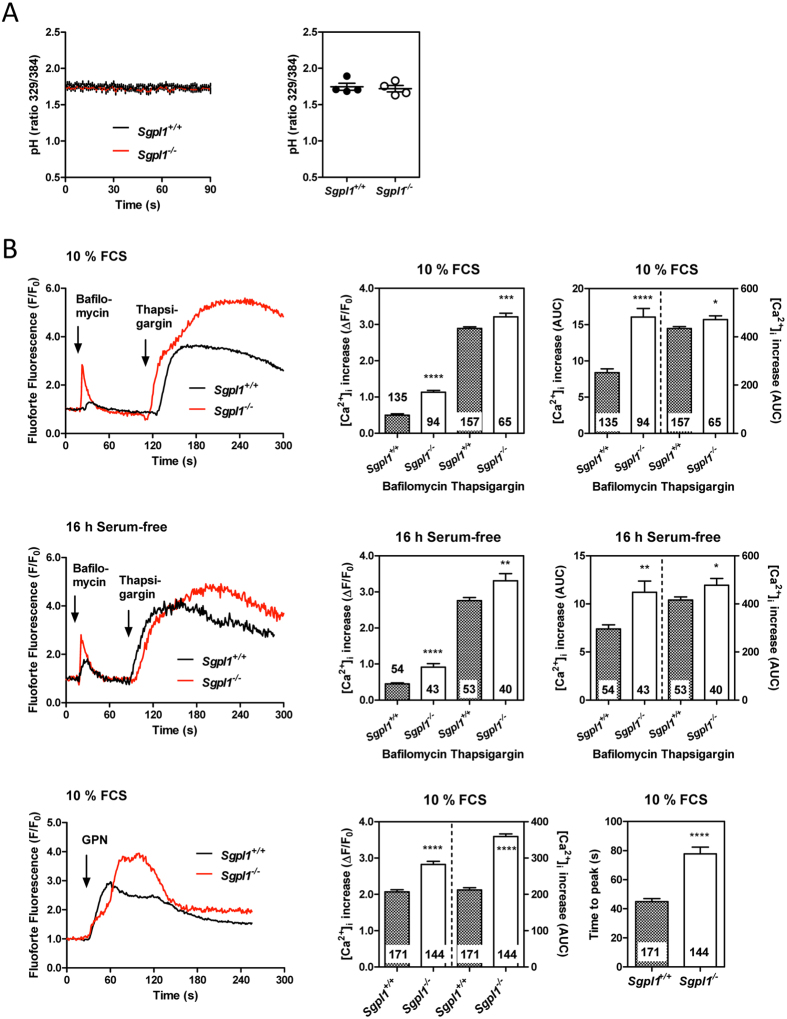
Figure 6. Lysosomal pH and Ca2+ release.
(A) Relative measurements of lysosomal pH were performed in cell suspensions after loading with 100 nM LysoSensor Yellow/Blue DND-160. Excitation was altered between 329 and 384 nm while emission was recorded at 490 nm. Left, stability of pH during the measurements. Excitation ratios were recorded for ~90–120 s. Lines represent means ± SEM of individual samples (n = 12 each). Right, means from 4 independent experiments with 3 samples each of both Sgpl1+/+- and Sgpl1−/−-MEFs. The cells had been kept for 16 h in serum-free medium. (B) [Ca2+]i increases were analyzed in MEFs grown on 8-well chambered coverslides and loaded with GFP-certified FluoForte. The cells were stimulated at the indicated time points with bafilomycin A1 (1 μM), thapsigargin (1 μM) or GPN (200 μM). Left, representative traces of [Ca2+]i from single cells. Right, quantifications of peak [Ca2+]i increases and AUCs. The values represent means ± SEM from the indicated number of individual cells. *p < 0.05; **p < 0.01; ***p < 0.001; ****p < 0.0001; t-test.

