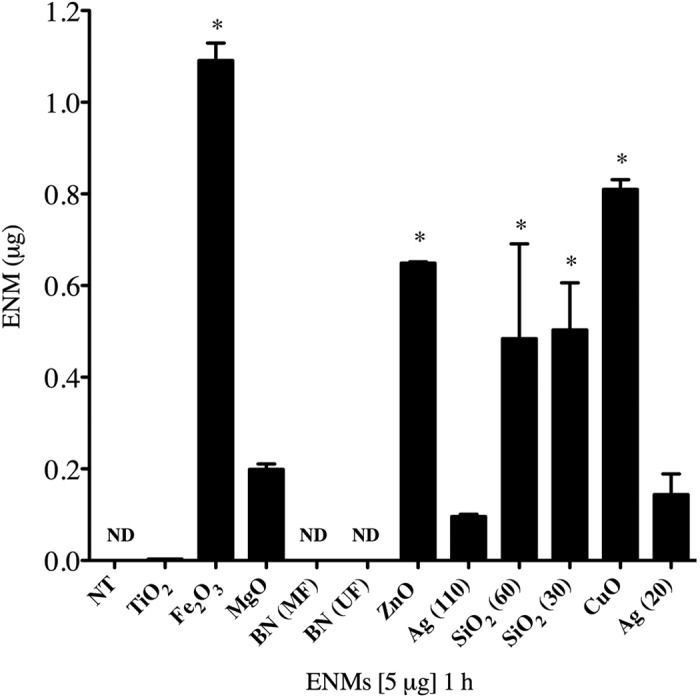
Figure 2. ICP-MS measurement of cell association of ENMs by bone-marrow-derived mast cells (BMMCs).

Mast cell association of ENMs was evaluated following 1 h exposure of 5 μg of ENMs. Values are expressed as mean ± SEM (n = 3/group). *Indicates significant difference between non-treated control groups (p ≤ 0.05). ND indicates non-detectable.
