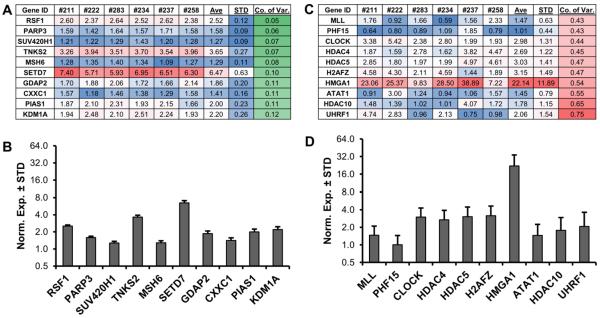
Figure 5. Stable and differentially expressed epigenetic regulators in MSCs.
RT-qPCR expression analysis of all epigenetic regulators (n = 321) was performed on six (three male, three female) non-proliferative (confluent) MSCs. Genes were sorted for average normalized expression value in six patients (value >1 with GAPDH set at 100). To assess the level of variability, the standard deviation (STD) was divided by the average expression (Ave) to generate the coefficient of variation (Co. of Var.) for each epigenetic regulator in the six MSCs. The ten most stable epigenetic regulators are shown (A). To demonstrate low levels of inter-patient variability, these ten highly stable genes are graphed (B). The ten most variable (`unstable') epigenetic regulators are shown for comparison (C) and further illustrated using bar graphs (D).

