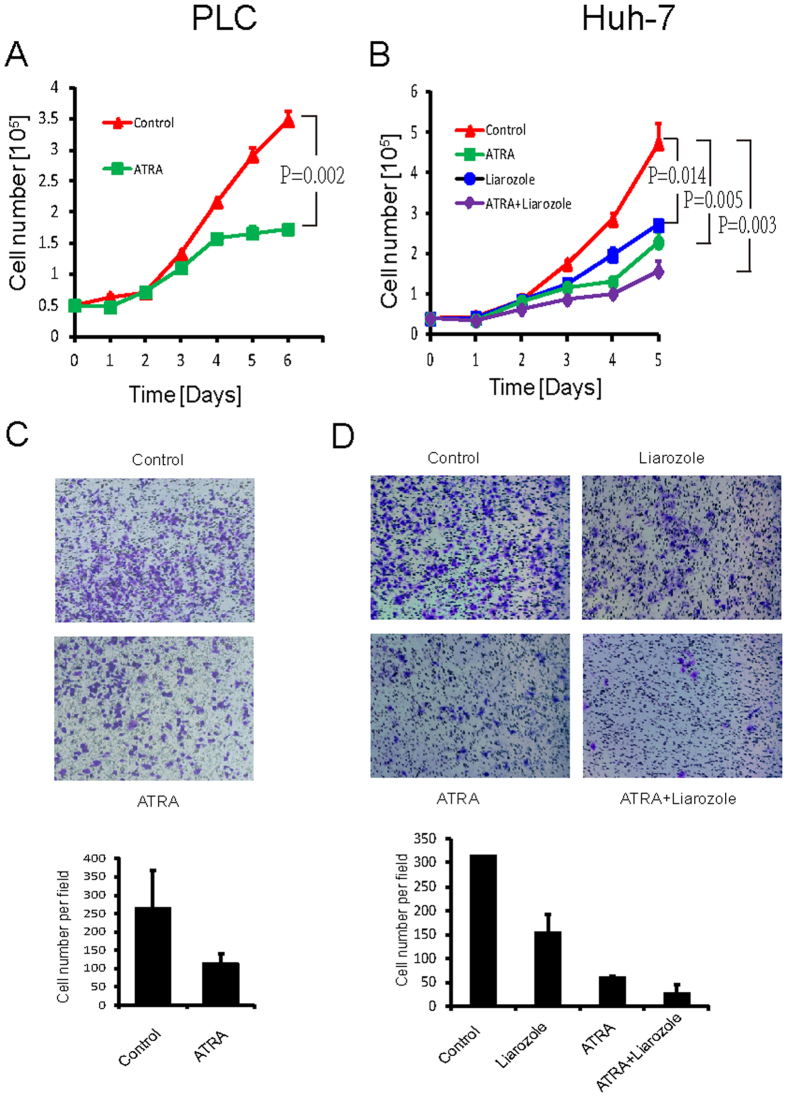
Figure 4. ATRA suppresses HCC cell growth and migration in vitro.
(A,B) PLC/PRF/5 (A) or Huh-7 (B) cells were treated with 10 μM ATRA and/or 25 μM P450 inhibitor liarozole and the growth curves were plotted over time. 5 × 10⁴ of PLC/PRF/5 cells or 3 × 10⁴ of Huh-7 were placed in each well of 12-well plate with triplicate for each time point. Error bars represent standard deviations (n = 3). p values were derived from the cell numbers at the end point. (C,D) PLC/PRF/5 (C) or Huh-7 (D) cells were treated with ATRA and/or P450 inhibitor liarozole, as evaluated by transwell assay. 5 × 10⁴ cells for both cell lines were used for this assay. Error bars represent standard deviations (n = 2).

