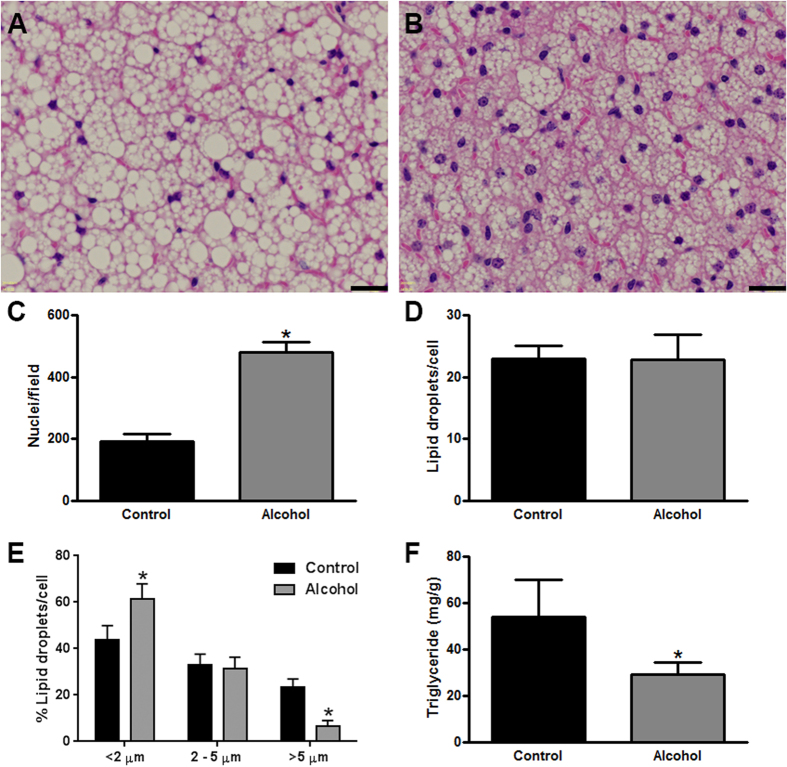
Figure 3. BAT of alcohol-fed mice has reduced lipid content.
Representative Hematoxylin and eosin-stained tissue sections of the intrascapular BAT depot from control (A) and alcohol consuming mice (B). Image analysis of BAT shows a significantly increased number of nuclei/field in alcohol fed mice (C). There was no significant difference in the number of lipid droplets/cell in control vs. alcohol-fed mice (D); however, alcohol-fed mice had a significantly smaller percentage of large lipid droplets, and a significantly higher percentage of small lipid droplets (E). The concentration of triglycerides in the BAT of alcohol-fed was significantly lower (F). Scale bars in A and B = 20 μm. (C–F) analyzed by Student’s t-test; *p < 0.05. Sample size: (C–E), all groups n = 3; (F) control and alcohol n = 5.

