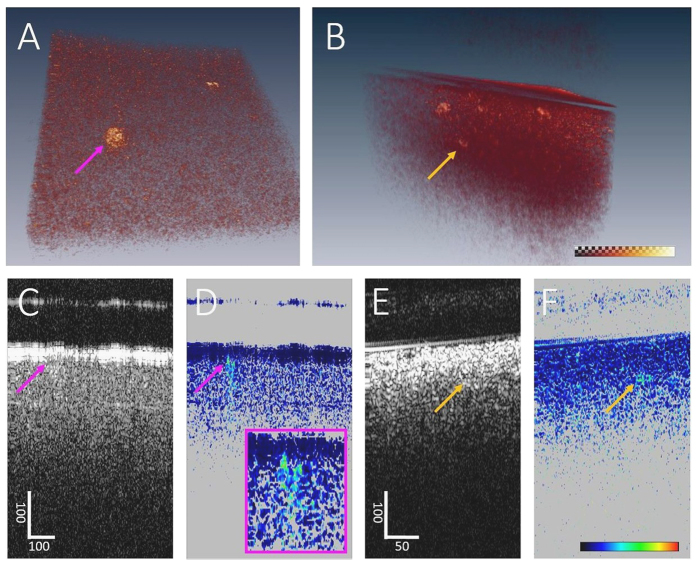
Figure 3. PS-OCM imaging of neuritic plaques in AD brains.
(A) Volume rendering showing increased phase retardation of Aβ plaques in the cortex of the frontal lobe. Dataset dimensions: 600 μm (x) × 600 μm (y) × 400 μm (z). (B) Volume rendering of cortical detail of the hippocampal formation. Dataset dimensions: 360 μm (x) × 360 μm (y) × 400 μm (z). The color maps are scaled from 7° to 41° with reduced transparency at higher retardation values (cf. checkerboard visibility). (C) Reflectivity B-scan image sectioning the plaque indicated by the pink arrow in (A). (D) Phase retardation data of the same B-scan. In contrast to the reflectivity image, the plaque stands out by increased phase retardation. Background pixels with low reflectivity are masked in grey. (E) Reflectivity B-scan sectioning the plaque indicated by the yellow arrow in (B). (F) Corresponding phase retardation showing the Aβ plaque located approximately 100 μm below the sample surface. Scale bars are in micrometers.

