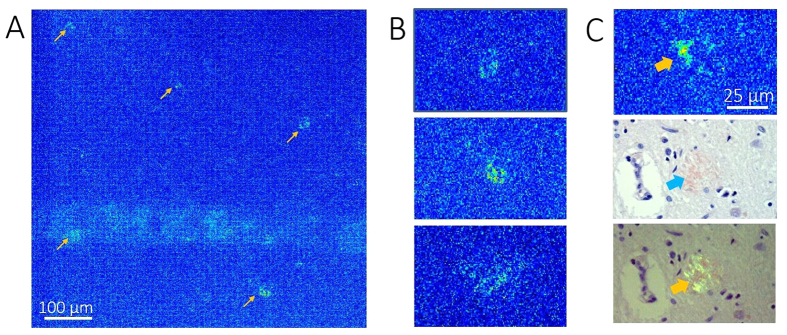
Figure 5. Aβ plaques imaged by PS-OCM and Congo red stained by microscopy.
(A) Maximum phase retardation projection image. Increased phase retardation can be observed at the locations of Aβ plaques. The bluish streak across the lower part of the image is a retardation artifact caused by a strong backreflection from the formol film covering the sample. (B) Details of (A) show the signals of individual plaques. (C) Comparison of neuritic plaque appearance in retardation image (top), bright field microscopy of Congo red stained section (middle), and polarization contrast microscopy of Congo red stained section (bottom). Under Congo red stain, the plaque appears red in bright field and “apple green” in polarization contrast microscopy.

